China 2020 Export Highlights
Top 10 U.S. Agricultural Exports to China(values in million USD) |
|||||||
| Commodity | 2016 | 2017 | 2018 | 2019 | 2020 | 2019-2020 % Change | 2016-2020 Average |
| Soybeans | 14,203 | 12,224 | 3,119 | 8,005 | 14,160 | 77% | 10,342 |
| Pork & Pork Products | 713 | 662 | 571 | 1,300 | 2,280 | 75% | 1,105 |
| Cotton | 554 | 978 | 925 | 707 | 1,826 | 158% | 998 |
| Corn | 40 | 142 | 50 | 56 | 1,205 | 2052% | 299 |
| Coarse Grains* | 1,030 | 838 | 521 | 191 | 1,153 | 504% | 747 |
| Poultry Meat & Products** | 34 | 36 | 47 | 10 | 762 | 7520% | 178 |
| Tree Nuts | 182 | 243 | 328 | 606 | 746 | 23% | 421 |
| Wheat | 205 | 351 | 106 | 56 | 570 | 918% | 258 |
| Dairy Products | 386 | 576 | 498 | 373 | 539 | 45% | 474 |
| Hay | 355 | 341 | 272 | 291 | 413 | 42% | 334 |
| All Other | 3,693 | 3,086 | 2,709 | 2,267 | 2,781 | 23% | 2,907 |
| Total Exported | 21,395 | 19,476 | 9,145 | 13,860 | 26,435 | 91% | 18,062 |
Source: U.S. Census Bureau Trade Data - BICO HS-10
*Excludes corn
**Excludes eggs
Highlights
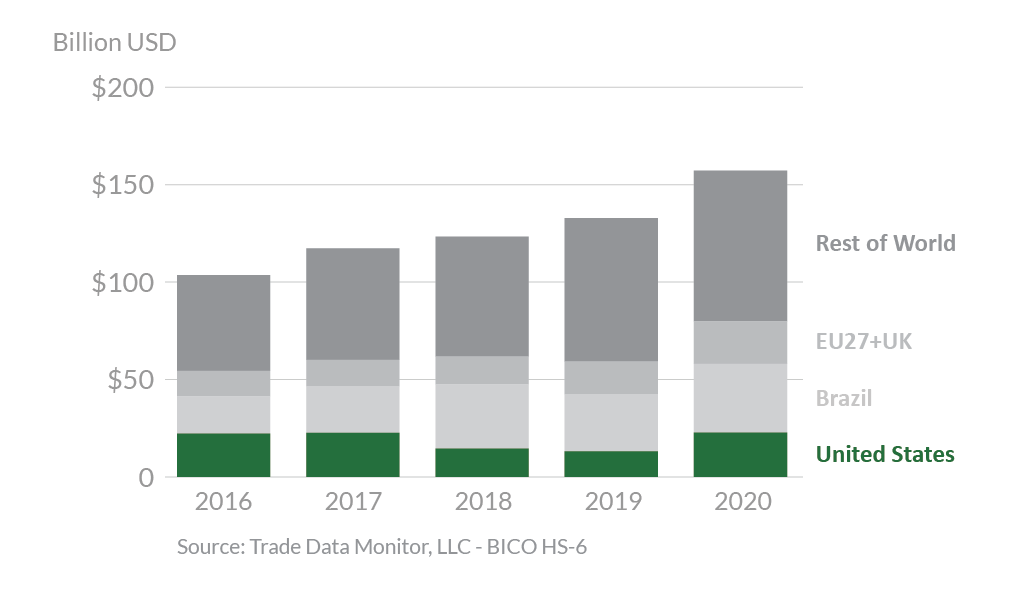
In 2020, U.S. agricultural exports to China totaled $26.4 billion, up $12.6 billion from 2019. China was the largest market for U.S. agricultural exports, a position it last held in 2016. Brazil (22 percent market share) and the United States (15 percent) were the top suppliers of agricultural goods to China, followed by the European Union with 14 percent. In 2020, China established a process for importers to seek exclusions for retaliatory Section 301 tariffs on U.S. products, including agricultural products. China also removed certain structural barriers to trade, expanding market access for a variety of U.S. agricultural exports in the world’s largest food import market. Exports of all top 10 commodity groups increased in 2020, with the largest increases for soybeans, corn, and cotton which were up $6.2 billion, $1.2 billion, and $1.1 billion, respectively. In addition, U.S. exports of pork & pork products, coarse grains (excluding corn), and poultry meat & products (excluding eggs) were up $980 million, $962 million, and $752 million, respectively. While exports for most commodity groups were up, a few including processed vegetables, hides & skins, and wine & beer were down $29 million, $23 million, and $18 million, respectively.
Drivers
- The Chinese Government created an exclusion process for retaliatory Section 301 tariffs on a wide range of products; imports of these products have risen significantly since this process was granted.
- China’s economic recovery from COVID-19 led to strong demand for U.S. agricultural products, including cotton, soybeans, wheat, and corn.
- African swine fever significantly reduced China’s swine herd, which led to increases in demand for U.S. pork & pork products. In addition, Chinese demand for U.S. soybeans and feed products grew, as China worked to rebuild its swine population.
China’s Agricultural Suppliers

Looking Ahead
China committed to purchases nearly $40 billion per year of U.S. agricultural products for the first 2 years (2020 and 2021) of the Phase One Agreement. Due in part to the COVID-19 pandemic and related impacts on global demand, China missed its commitment by about 30 percent. Under the agreement, China removed specified structural barriers to U.S. agricultural products with 50 of these 57 commitments implemented on time. China also implemented a program to exempt retaliatory tariffs which improves the competitiveness of U.S. goods.
China’s strong demand for U.S. agricultural products is expected to continue. China recovered from COVID-19 more quickly than most of the world and is increasing purchases of U.S. agricultural products, including corn, soybeans, and other animal feeds needed to replenish its growing swine heard. Continued economic growth and an expanding middle-class also bodes well for increased exports of poultry, fruits and vegetables, and other higher-valued consumer- oriented goods.
