Cotton 2020 Export Highlights
Top 10 Export Markets for U.S. Cotton(values in million USD) |
|||||||
| Country | 2016 | 2017 | 2018 | 2019 | 2020 | 2019-2020 % Change | 2016-2020 Average |
| China | 551 | 973 | 920 | 705 | 1,821 | 158% | 994 |
| Vietnam | 788 | 1,056 | 1,312 | 1,429 | 1,163 | -19% | 1,150 |
| Pakistan | 202 | 297 | 615 | 628 | 788 | 25% | 506 |
| Turkey | 495 | 730 | 682 | 648 | 577 | -11% | 626 |
| Bangladesh | 95 | 284 | 387 | 388 | 330 | -15% | 297 |
| Indonesia | 346 | 498 | 600 | 416 | 264 | -37% | 425 |
| Mexico | 339 | 404 | 372 | 288 | 178 | -38% | 316 |
| India | 251 | 435 | 333 | 587 | 148 | -75% | 351 |
| Thailand | 164 | 213 | 272 | 215 | 119 | -44% | 197 |
| South Korea | 165 | 248 | 231 | 167 | 111 | -34% | 184 |
| All Others | 564 | 689 | 826 | 671 | 470 | -30% | 644 |
| Total Exported | 3,959 | 5,827 | 6,550 | 6,141 | 5,968 | -3% | 5,689 |
Source: U.S. Census Bureau Trade Data - BICO HS-10
Highlights
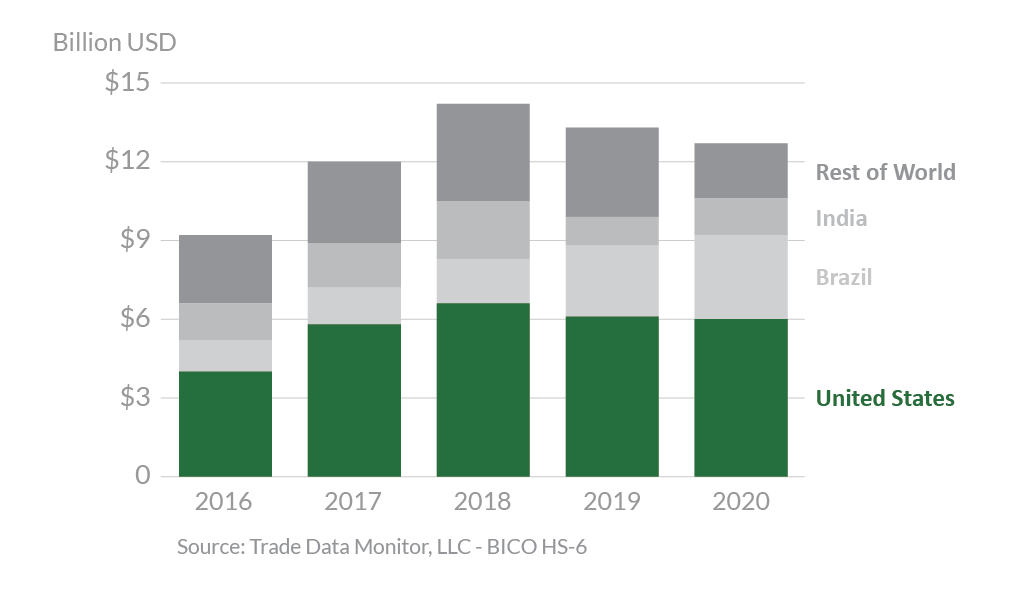
U.S. exports of cotton declined 3 percent in 2020 to $6 billion but remained the fifth-highest export value on record. Exports to China surged by more than 150 percent to reach a 7-year high. Exports to Pakistan realized their fifth consecutive record. Exports to other markets were largely down, with 15 of the top 20 markets down by more than 30 percent. Much of the increase to China was destined for the State Reserve (SR), which limited supplies available for other markets. Brazil, which saw its third consecutive record crop, increased its market share relative to the United States in 20 of the top 25 import markets.
Global consumption in 2020 was dramatically affected by COVID-19 as consumer demand shrank and mill use fell by nearly 20 percent. Trade volume was reduced by nearly 10 percent. World and U.S. prices fell sharply in the first quarter of 2020 due to concerns over the impact of COVID-19 and large global stocks. However, prices rallied mid-year, supported by increasing prices for other commodities, and ended the year at a 2-year high.
Drivers
- Global impact of COVID-19 sharply decreased demand for cotton/textiles.
- China State Reserve purchases of U.S. cotton limited availability of high-grade cotton to other markets.
- Increased competition dampened U.S. exports as Brazil expanded export capacity and shipped record volumes year-round, including during typically slow export months.
Global Cotton Exports

Looking Ahead
U.S. cotton exports are forecast unchanged at 15.5 million bales for the marketing year ending July 2022. Global trade volume is also expected stable.
SR purchases of U.S. cotton fueled shipments to China, and these types of purchases in 2021 are expected to shift back to domestic cotton, limiting U.S. sales.
Strong competition from key competitors such as Brazil is also expected to dampen U.S. exports. Brazil’s projected crop in the coming months is only down slightly from last year’s third consecutive record crop.
