Dairy 2020 Export Highlights
Top 10 Export Markets for U.S. Dairy(values in million USD) |
|||||||
| Country | 2016 | 2017 | 2018 | 2019 | 2020 | 2019-2020 % Change | 2016-2020 Average |
| Mexico | 1,218 | 1,312 | 1,398 | 1,546 | 1,416 | -8% | 1,378 |
| Canada | 630 | 637 | 641 | 667 | 676 | 1% | 650 |
| China | 386 | 576 | 498 | 373 | 539 | 45% | 474 |
| Philippines | 227 | 243 | 246 | 273 | 410 | 50% | 280 |
| South Korea | 231 | 279 | 290 | 330 | 371 | 12% | 300 |
| Indonesia | 158 | 132 | 165 | 239 | 352 | 47% | 209 |
| Japan | 206 | 291 | 269 | 282 | 322 | 14% | 274 |
| Vietnam | 120 | 112 | 145 | 170 | 185 | 9% | 146 |
| Australia | 109 | 185 | 153 | 148 | 170 | 15% | 153 |
| Malaysia | 87 | 90 | 101 | 109 | 157 | 45% | 109 |
| All Others | 1,327 | 1,520 | 1,586 | 1,788 | 1,856 | 4% | 1,615 |
| Total Exported | 4,698 | 5,377 | 5,493 | 5,924 | 6,453 | 9% | 5,589 |
Source: U.S. Census Bureau Trade Data - BICO HS-10
Highlights
U.S. dairy product exports grew by 9 percent to reach $6.5 billion in 2020 despite significant challenges posed by the COVID-19 pandemic and ongoing trade policy issues with Canada and China. While still below the record level in 2014, this was the fourth year in a row that the value of U.S. dairy product exports expanded, registering an average annual growth rate of 8 percent over this period.
Mexico, Canada, and China were the top three markets, accounting for about 45 percent of sales. Sales to Mexico were down 8 percent due to the COVID-19 pandemic leading to slower economic growth and reduced consumer spending. Southeast Asia remains a critical region for growth, with the value of dairy shipments up an impressive 25 percent from 2019 to reach $2.7 billion. There were notable increases in exports of whey & whey products to China, and skimmed milk powder (SMP) to the Philippines and Indonesia.
Drivers
- China started to rebuild its pig herd and demand for pig feeds led to growth in imports of U.S. whey & whey products.
- Global demand for dairy products was surprisingly strong in 2020 while the availability of exportable stocks was lower than in 2019. This was particularly true for SMP as EU27+UK surplus intervention stocks were completely drawn down. As a result, U.S. exporters made strong gains in Asian markets, particularly Indonesia and the Philippines.
- The low value of the U.S. dollar plus the availability of ample stocks meant that U.S. dairy products were competitive on major global markets.
- Mexican imports of U.S. dairy products declined due to a deteriorating macroeconomic situation resulting from low oil prices, a deep recession, a weak currency, and COVID-19 pandemic measures.
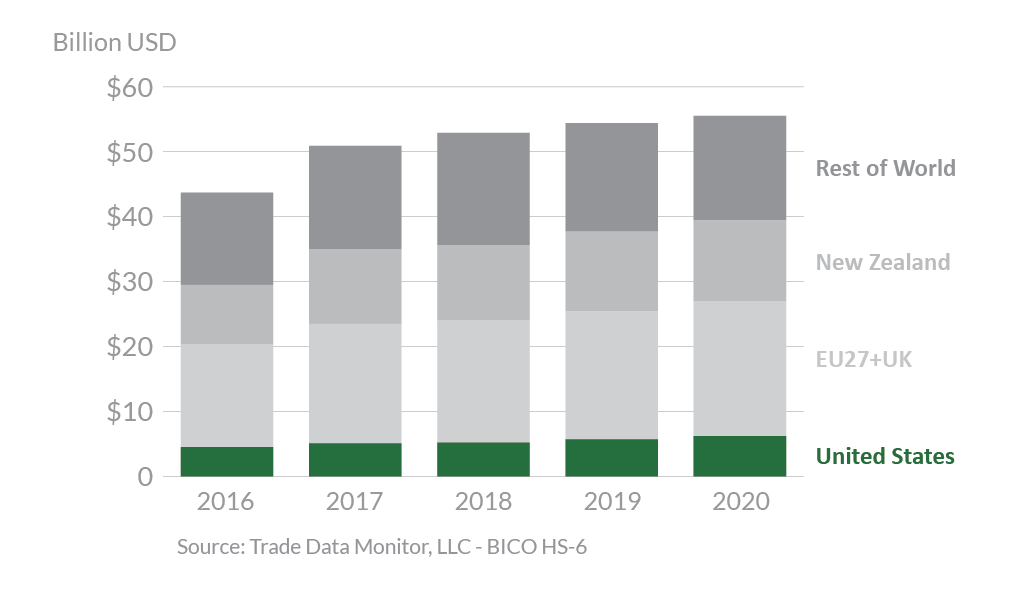
Global Dairy Exports

Looking Ahead
Despite ongoing trade policy challenges, the outlook for U.S. dairy exports in 2021 is positive. The global economy is expected to improve, and import demand is expected to remain robust. U.S. milk production is forecast to grow by nearly 2 percent while milk output from competitors, including New Zealand and the EU27+UK, is expected to be more moderate, growing by less than 1 percent. Early in 2021, international prices for several key dairy products are rising, underscoring some tightness in exportable supplies among competitors. The U.S. dairy industry is well positioned with competitive prices and ample exportable supplies of key products including milk powder, cheese, butter, and whey & whey products.
Most of the growth in U.S. exports is expected to be in Mexico and Asia where import demand for dairy products is being driven by higher per capita incomes and an expanding middle class. In China, there is the additional factor of rebuilding the swine herd which already boosted imports of U.S. whey & whey products in late 2020. For the year, U.S. exports of dairy products on a fat-basis are forecasted to grow by 8 percent, primarily due to higher volumes of butter. On a skim-solid milk equivalent basis, exports are forecasted to grow by 3 percent due to increased shipments of SMP and whey & whey products. On a skimmed milk equivalent basis, this will mean that approximately 22 percent of U.S. milk production will be exported.
