EU Agricultural Exports, Trade Surplus with U.S. Reach Record Levels in 2015
Contact:
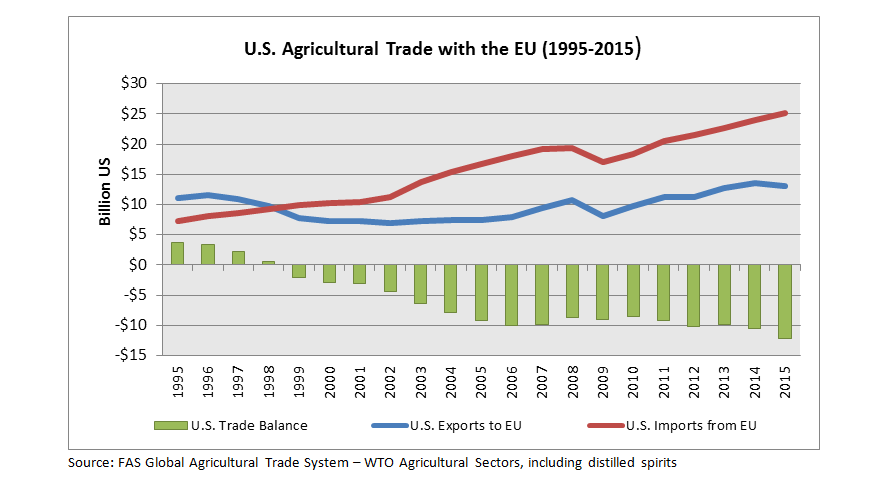
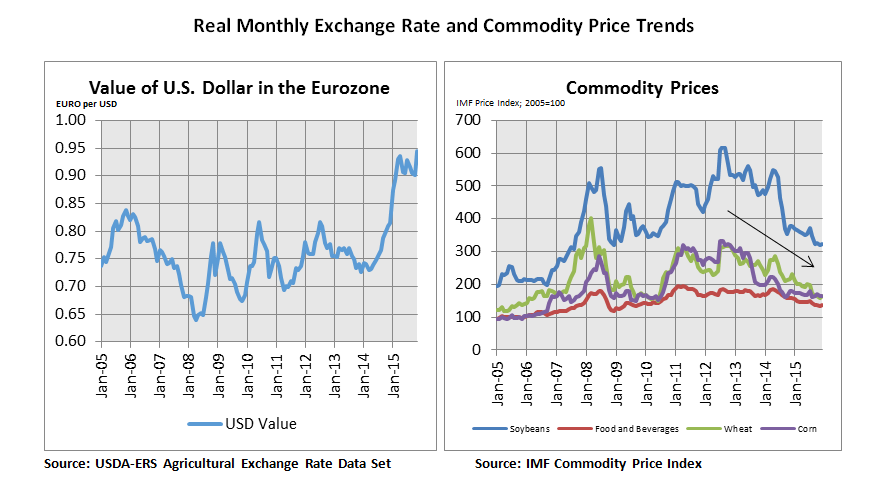
As the Transatlantic Trade and Investment Partnership (TTIP) negotiations intensify, it is worth taking a fresh look at agricultural trade flows between the United States and the European Union. While the United States had a $16 billion agricultural trade surplus with the rest of the world in 2015, it ran a record $12 billion trade deficit in farm and food products with the European Union (EU), up 15 percent from 2014. Thanks to strong American demand for the EU’s high-value products, and a relatively open market, the United States imported a record $25 billion in food and agricultural products in 2015. Meanwhile, U.S. exports to the EU declined four percent to just under $13 billion, largely as a result of low commodity prices and the strength of the U.S. dollar, which has appreciated 25 percent against the Euro since January 2014. During most of the past decade, EU demand for consumer-oriented products helped increase U.S. exports. However, in recent years, U.S. sales have grown at a slower pace than imports from Europe. At the same time, U.S. exports are disadvantaged by market access restrictions on a number of our most competitive commodities and higher tariffs than countries which enjoy preferential market access privileges with the EU.

EU Ag Imports Growing Fast; U.S. Market Share Lagging Behind
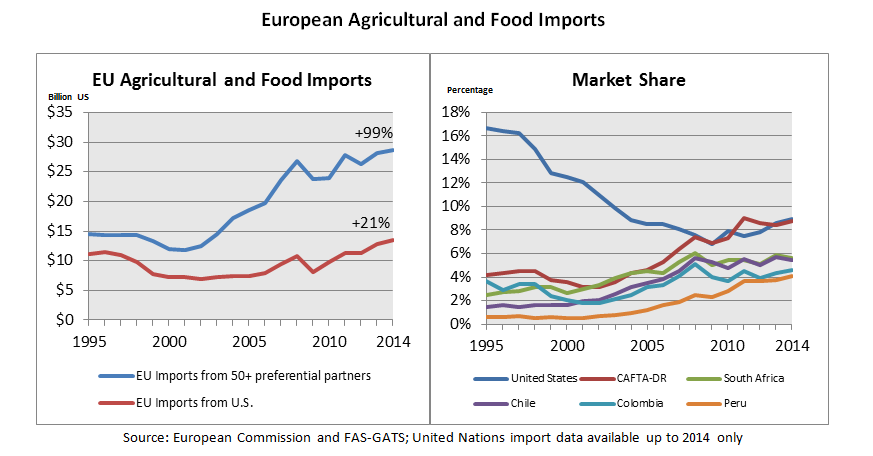
The EU is the world’s largest importer of agricultural and food products, followed by the United States and China. The EU is a highly diversified market in terms of both products and suppliers. Even though the United States is Europe’s second-largest supplier of agricultural and food products after Brazil, U.S. sales accounted for just 10 percent of Europe’s agricultural imports in 2015, down from 17 percent in 1995. While EU agricultural imports more than doubled over the past two decades, reaching a robust $126 billion in 2015, U.S. exports into the region increased at a slower rate – rising only 17 percent over the same period. U.S. exports of consumer-oriented products have been a key propeller of the growth, but European tariff and non-tariff import requirements and current global market conditions continue to challenge U.S. export growth to the EU.
U.S. Export Growth to EU Driven by Consumer-Oriented Products
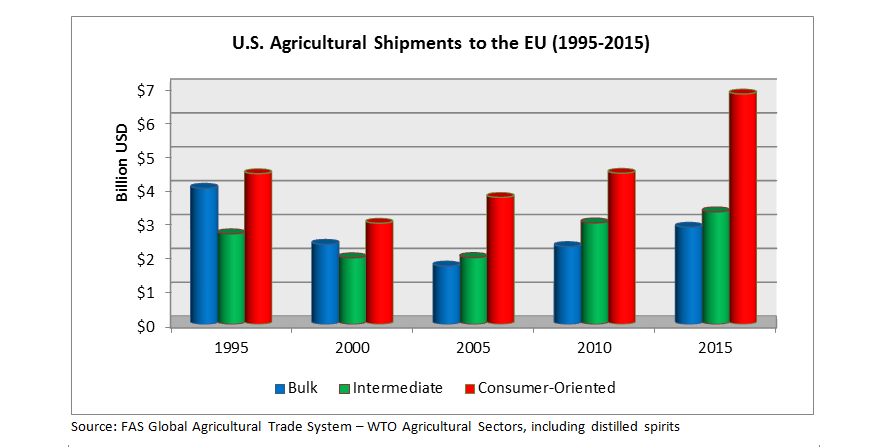
At a record $7 billion in 2015, sales of consumer-oriented products accounted for over half of U.S. agricultural and food exports to the EU. Over the past two decades, exports of bulk commodities have declined by nearly 30 percent, while shipments of consumer oriented products have grown by over 50 percent fueled by the growing European consumer demand for a rich variety of value-added products.

Among the top U.S. consumer-oriented products exported to the EU, the following categories showed the most significant changes in recent years:
Tree Nuts: U.S. tree nut shipments to the EU doubled in the last decade, reaching a record $2.9 billion in 2015. Sales have expanded significantly across different nut categories. Almonds accounted for nearly two-thirds of U.S. tree nut exports to the EU last year, totaling nearly $2 billion, followed by walnuts with more than $440 million in sales and pistachios with $410 million. The United States, the world’s top almond supplier, is producing at record levels and accounts for 80 percent of the world’s supply of almonds.
| U.S. Consumer-Oriented Product Exports to the EU | |||||
| Product | 2014 (Million US) | 2015 (Million US) | Year-on-Year Change | ||
| Tree Nuts | $2,772 | $2,977* | 7% | ||
| Distilled Spirits | $750 | $770* | 3% | ||
| Wine and Beer | $564 | $685* | 22% | ||
| Processed Fruit | $365 | $328 | -10% | ||
| Beef and Beef Products | $275 | $306* | 11% | ||
| Processed Vegetables | $204 | $171 | -17% | ||
| Fruit and Vegetable Juices | $143 | $129 | -10% | ||
| Snack Foods | $118 | $128* | 9% | ||
| Non-Alcoholic Bev. (ex. juices) | $96 | $104* | 9% | ||
| Fresh Vegetables | $83 | $103* | 25% | ||
| Source: FAS Global Agricultural Trade System – BICO HS-10 | * record | ||||
Distilled Spirits: In 2015, U.S. distilled spirit exports climbed three percent to a record $770 million, dominated by strong sales of whiskey at more than $640 million. Meanwhile, European exports of distilled spirits to the United States were more than six times greater than U.S. sales to Europe, totaling $5.1 billion in 2015. This disparity resulted in a net trade deficit for the United States of more than $4.3 billion. The EU is the top destination for U.S. shipments of distilled spirits and the world’s second-largest consumer of alcoholic beverages overall.
Wine and Beer: The United States is the world’s fourth-largest exporter of wine, and the third-largest supplier of wine and beer combined. U.S. shipments of wine to the EU rebounded from low sales in 2014 to a record $618 million last year amid a highly competitive European market. However, the United States continues to run a trade deficit at a record $3.2 billion last year driven by strong American imports from the EU at $3.8 billion. U.S. sales of beer and other fermented beverages rose 34 percent from 2014 to a record $67 million in 2015.
Processed Fruits and Vegetables: U.S. sales of processed fruits and vegetables to Europe declined from 2014 to 2015, both in terms of volume and value. Processed fruit exports fell 10 percent, to $328 million, while processed vegetable exports fell 17 percent, to $171 million. U.S. exports of fruit and vegetable juices also declined in both volume and value, with sales down 10 percent to $129 million in 2015.
Beef and Beef Products: The United States is the European Union’s fourth-largest supplier of beef and beef products after Brazil, Argentina, and Uruguay. However, significant volumes of beef are transshipped to other non-EU countries. The value of U.S. exports to the EU was up 11 percent from 2014 to a record $306 million in 2015. However, volumes remain nearly unchanged and growth is limited by the European Union’s beef quota regime.
Snack Foods: U.S. snack foods sales reached a record $128 million in 2015, up nine percent from the previous year, growing in both value and volume. The United States is the European Union’s third-largest supplier of snack foods after Switzerland and Turkey. However, U.S. snack imports from EU were 10 times greater than exports, reaching $1.3 billion last year.
Non-Alcoholic Beverages: U.S. sales of non-alcoholic beverages to the EU increased three-fold in the last decade. Despite a decrease in unit value for the last three consecutive years, growing demand pushed the overall value of exports to a record $104 million in 2015.
Soybeans Dominate U.S. Bulk and Intermediate Sales
U.S. exports of bulk commodities and intermediate products to the EU have remained relatively stable over the last decade. However, falling commodity prices and the increasing value of the dollar are putting downward pressure on the value of those U.S. exports.

Among the U.S. top bulk and intermediate product exports, the following commodities have experienced significant changes in recent years.
Soybeans and Soybean Products: Soybeans and soybean products (specifically meal and oil) are the United States’ second-largest agricultural export to the EU, after tree nuts, totaling nearly $2.3 billion in 2015, which was down $190 million from the previous year. Although the volume of soybean exports to the EU was up 22 percent to 4.9 million metric tons, the value remained nearly unchanged at $1.9 billion. Soybean meal exports declined 35 percent in value, to $394 million, and 21 percent in volume, to 900 million metric tons, in the face of lower-priced competition from Argentina and Brazil.
| U.S. Bulk and Intermediate Product Exports to the EU | |||||
| Product | 2014 (Million US) | 2015 (Million US)(Million US) | Year-on-Year Change | Ten-Year Change | |
| Soybeans | $1,860 | $1,878* | 1% | 160% | |
| Planting Seeds | $366 | $420* | 15% | 111% | |
| Soybean Meal | $602 | $394 | -35% | 3554% | |
| Vegetable Oils (ex. soybeans) | $355 | $352 | -1% | 52% | |
| Feeds and Fodder | $350 | $298 | -15% | -20% | |
| Wheat | $208 | $284 | 37% | 138% | |
| Tobacco | $251 | $238 | -5% | -59% | |
| Hides and Skins | $221 | $172 | -22% | 26% | |
| Live Animals | $206 | $140 | -32% | -48% | |
| Pulses | $156 | $129 | -18% | 117% | |
| Source: FAS Global Agricultural Trade System – BICO HS-10 | * record | ||||
Planting Seeds: The EU has been a growing market for U.S. planting seed exports, with sales doubling in the last decade to a record $420 million in 2015. Sunflower seeds dominate sales with $128 million last year, up 57 percent, with an increased volume of shipments.
Vegetable Oils: U.S sales are struggling to recover to 2012’s record levels, and the value of vegetable oil shipments (excluding soybean oil) continued to decline, totaling $352 million in 2015, heavily impacted by low commodity prices.
Feeds and Fodder: Exports of feeds and fodder have been highly volatile during the last decade, and fell 15 percent from last year to $298 million in 2015. Exports of corn gluten fell 40 percent to $67 million last year.
Wheat: Following a drop in 2014 when the United States lost market share to low-priced Canadian wheat, U.S. wheat shipments to the EU in 2015 were up 37 percent in value, to $284 million, and 47 percent in volume, to 916,000 metric tons.
Countries with European Preferential Treatment Gaining Market Share
Currently, the EU has preferential trade agreements in place with more than 50 countries, including important agricultural and food producers such as CAFTA-DR countries, South Africa, Chile, Colombia, Peru, and Mexico among many others. Shipments of agricultural and food products from these countries to the EU more than doubled in the last fifteen years, while U.S. sales increased at a considerably lower rate. Moreover, the market share of U.S. exports has been declining, while European trade partners enjoying preferential agreements have notably increased their market participation over the same period. Tariff preferences granted to these countries give them an advantage over U.S. exports.
CAFTA-DR shipments to the EU are predominantly composed of tropical fruits, although sales of beverages, including distilled spirits, sky-rocketed in the last decade, increasing 20-fold to $237 million in 2014 (the most recent year for which foreign country import data are available). South African sales to the EU more than doubled since 2000 to more than $3 billion in 2014, pushed up largely by increased exports of fresh fruit and other horticultural products which totaled more than $2 billion in 2014. South African wine exports remained very strong and were at nearly $550 million in 2014.

Chilean agricultural exports to the EU increased three-fold since 2000, reaching more than $3 billion in 2014. Chilean sales were also dominated by fresh fruit and other horticultural shipments and beverages. Since 2007, Chilean wine exports to the EU, totaling more than $800 million in 2014, surpassed U.S. sales of wine to Europe. European imports from Colombia and Peru increased by two-fold and seven-fold respectively over the last fifteen years. Colombia’s shipments grew significantly across product categories and totaled more than $2 billion in 2014. Finally, Peru continued increasing its market share in Europe with solid exports of horticultural and processed food products, which totaled $1.7 billion and more than $400 million respectively.
U.S.-EU Trade Deficit at Record High
Despite a four percent drop in U.S. agricultural exports to the EU, sales to the region performed better than overall global U.S. exports which fell by 11 percent last year. However, the U.S. trade deficit with the EU reached a record in 2015, with record high U.S. imports from the EU driven by the United States strong economic performance and a high demand for European consumer-oriented products. Distilled spirits, wine and beer, and dairy products were among the top U.S. imports from the EU in 2015, with trade deficits at $4.3 billion, $3.2 billion, and $1.3 billion respectively.
Although the European market showed healthier than expected economic growth at 1.8 percent in 2015, U.S. export growth to the EU slowed largely driven by low commodity prices and the appreciating value of the dollar. Moving forward prospects for two percent growth of the European economy in 2016, could support stable demand growth for agricultural and food products.
The U.S.- EU TTIP negotiations provide an opportunity for the United States to correct these imbalances. Tariff reductions in the EU could put U.S. exports on a more level playing field with other suppliers. Discussions related to regulatory barriers, in particular unjustified health and safety measures, could provide new access for U.S. exports. The TTIP would also improve opportunities for EU exports, benefitting producers and consumers in both regions.
Note: This report uses BICO (HS-10), WTO-agricultural sectors, and United Nations data from the FAS Global Agricultural Trade System (GATS). WTO-agricultural sectors include distilled spirits, ethanol, and cigarettes as defined by the WTO Agreement on Agriculture. At the time of publication, the most recent full-year UN import data available for nearly all countries were from 2014. Only external-EU trade is counted.
