Growing Opportunities for U.S. Agricultural Exporters in Chile and Peru
Contact:
South America is one of the fastest-growing world regions for exports of U.S. farm and food products, and Chile and Peru are among the most rapidly growing markets in the region. The United States enjoys strong trading relationships with both countries thanks to existing free trade agreements. In addition, both nations are part of the Trans-Pacific Partnership (TPP). Implementation of the TPP will further boost the Chilean and Peruvian economies and strengthen supply chains, creating additional demand for U.S. food and agricultural products.
Over the past decade, U.S. agricultural exports to South America have grown by 182 percent overall, with exports to Chile and Peru increasing by 172 percent and 436 percent, respectively. In 2015, U.S. farm and food exports to Chile totaled $853 million, while exports to Peru totaled $1.1 billion. The United States is a top supplier to both countries and U.S. products comprise an increasing share of both Chile’s and Peru’s overall agricultural imports. In 2014 (the most recent year for which data are available) the United States was Chile’s second-largest supplier (after Argentina) with a 15-percent market share, and Peru’s top supplier, with a 24-percent market share.
Lower commodity prices and a strong U.S. dollar led to an overall decline in U.S. agricultural exports in 2015. While U.S. exports to South America fell 21 percent from 2014 levels, they fared better in Chile and Peru – down six percent and 12 percent, respectively.
With mining and agriculture playing an important part in both countries’ economies, the decline in global commodity prices has had a dampening effect on economic growth. Although there were signs of an economic recovery in 2015, real growth in the region may remain modest until world commodity prices rebound. Nevertheless, both Chile and Peru have growing middle class populations, driving increased demand for goods across all sectors – and for consumer-oriented goods in particular. That demand, coupled with business-friendly government policies in both countries, means solid opportunities still exist for U.S. agricultural exporters.
Agricultural Exports to Chile
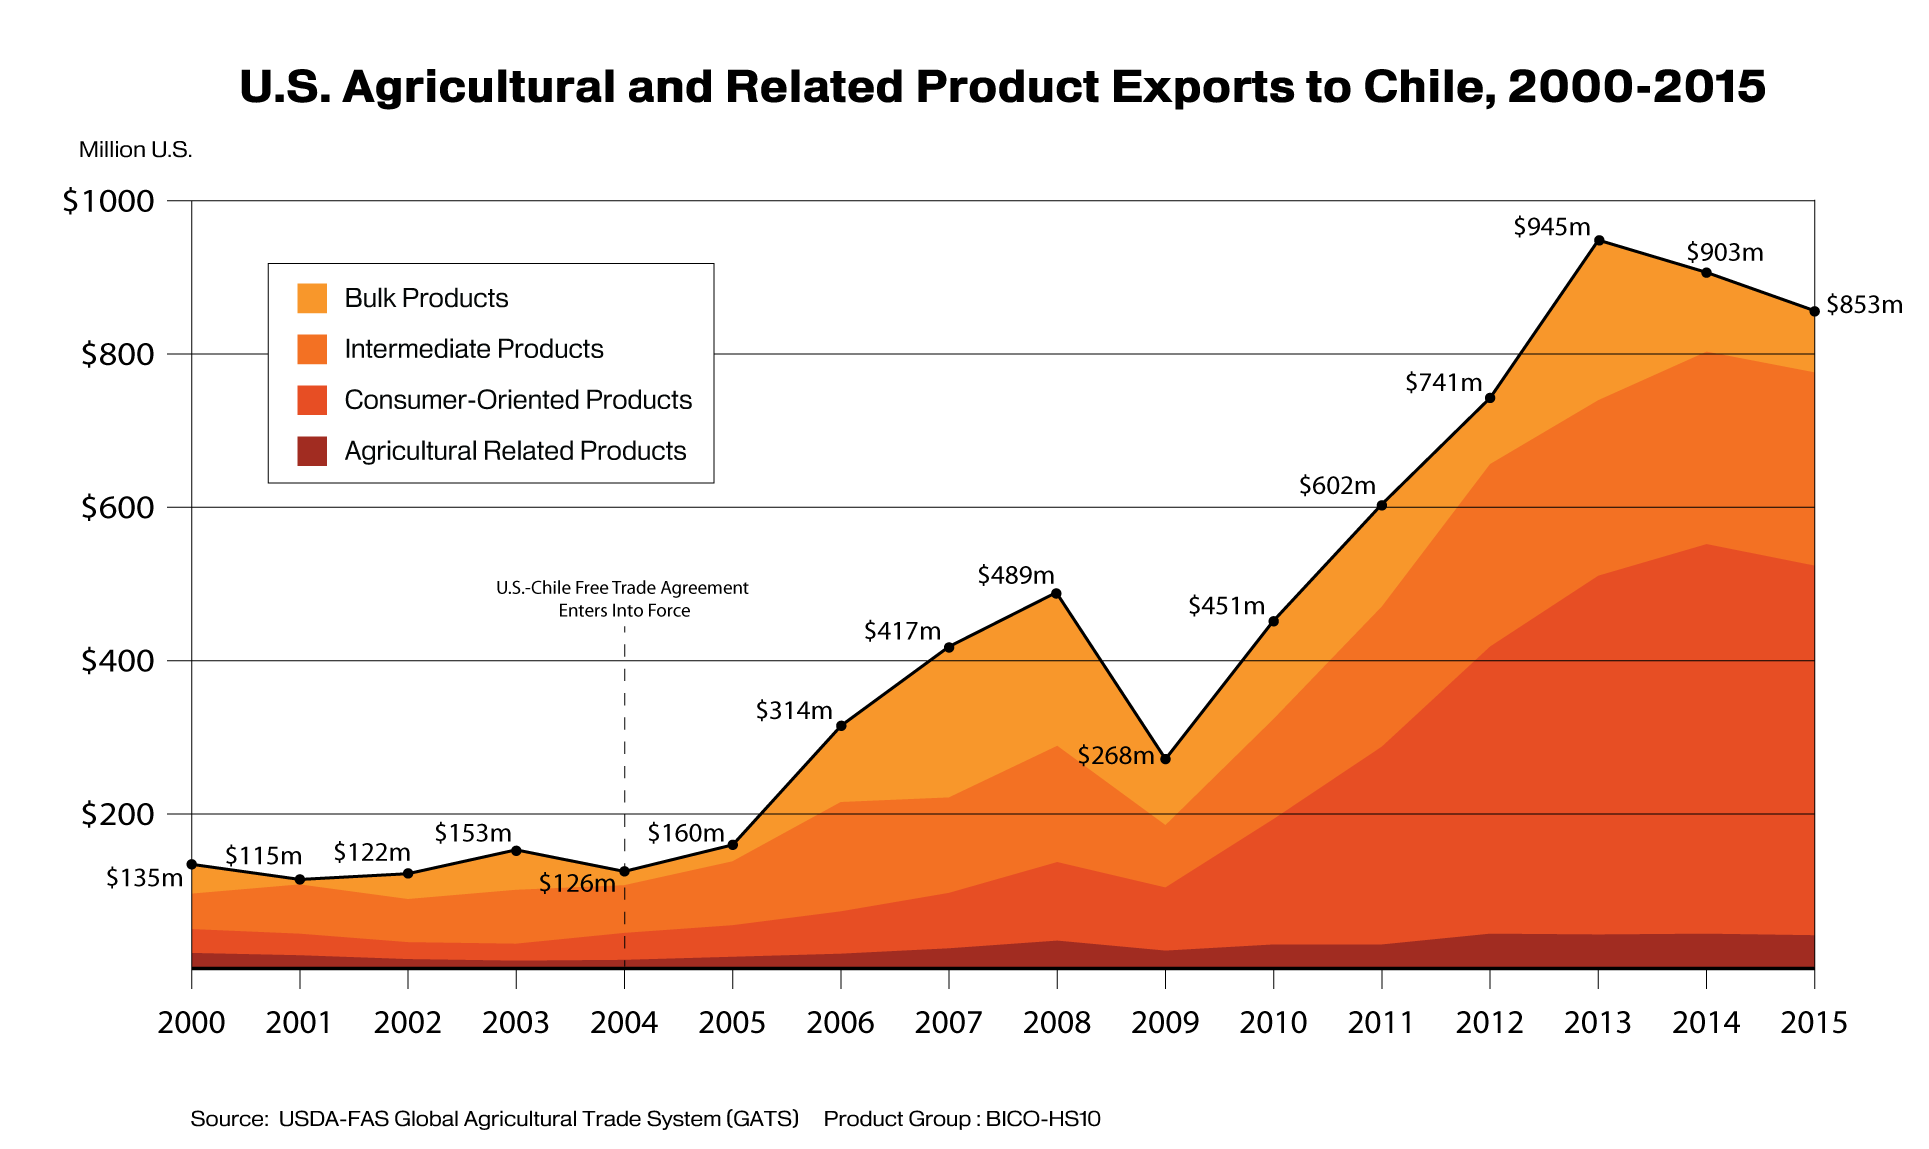
The U.S.-Chile Free Trade Agreement entered into force in 2004 and all U.S. products now enter Chile duty free. Since the agreement was enacted, U.S. exports of agricultural and related products to Chile have grown more than 500 percent, reaching $903 million in 2014 and $853 million in 2015.
The growth in U.S. agricultural exports to Chile over the past 12 years has occurred across the bulk, intermediate, consumer-oriented, and agricultural-related sectors, with the most significant increase being in consumer-oriented products. U.S. exports of consumer-oriented products to Chile went from just $35 million in 2004 to $480 million in 2015 – an increase of more than 1,200 percent. Exports of consumer-oriented goods accounted for 59 percent of all U.S. agricultural exports to Chile in 2015. Poultry, dairy, beef, wine and beer, pork, and condiments and sauces represented more than two-thirds of Chile’s total purchases of consumer goods from the United States last year, with prepared foods, tree nuts, non-alcoholic beverages, and chocolate and cocoa products also ranked in the top ten.
The main bulk commodity exported by the United States to Chile is wheat, while feeds and fodder are top in the intermediate products sector and forest products are top among agricultural-related products. U.S. exports to Chile face competition from domestic and South American (Argentina, Brazil, and Paraguay, in particular) suppliers in all sectors.

Chile Overview and Outlook
Chile is classified by the World Bank as a “high income” economy and it has the highest GDP per capita in South America. The country fared well in the latest global economic slowdown, thanks to sound fiscal policies that make it one of the most stable economies in the South American region. The World Bank ranks Chile second among Latin America and Caribbean countries in its “Ease of Doing Business” ratings.
Chile has a population of about 17 million, of which 43 percent are adults between the ages of 25 and 54 – their prime spending years. With increasing disposable incomes, consumer spending is forecast to grow at an average annual rate of 3.9 percent through 2030. Currently, 15.5 percent of Chilean’s consumer expenditures are on food and, as incomes rise, so have consumers’ preferences for bread, meat, fish, seafood, milk, confectionery, fruit, and vegetables. Imported foodstuffs have grown in popularity in recent years, and are regularly found on supermarket shelves.
Agricultural Exports to Peru
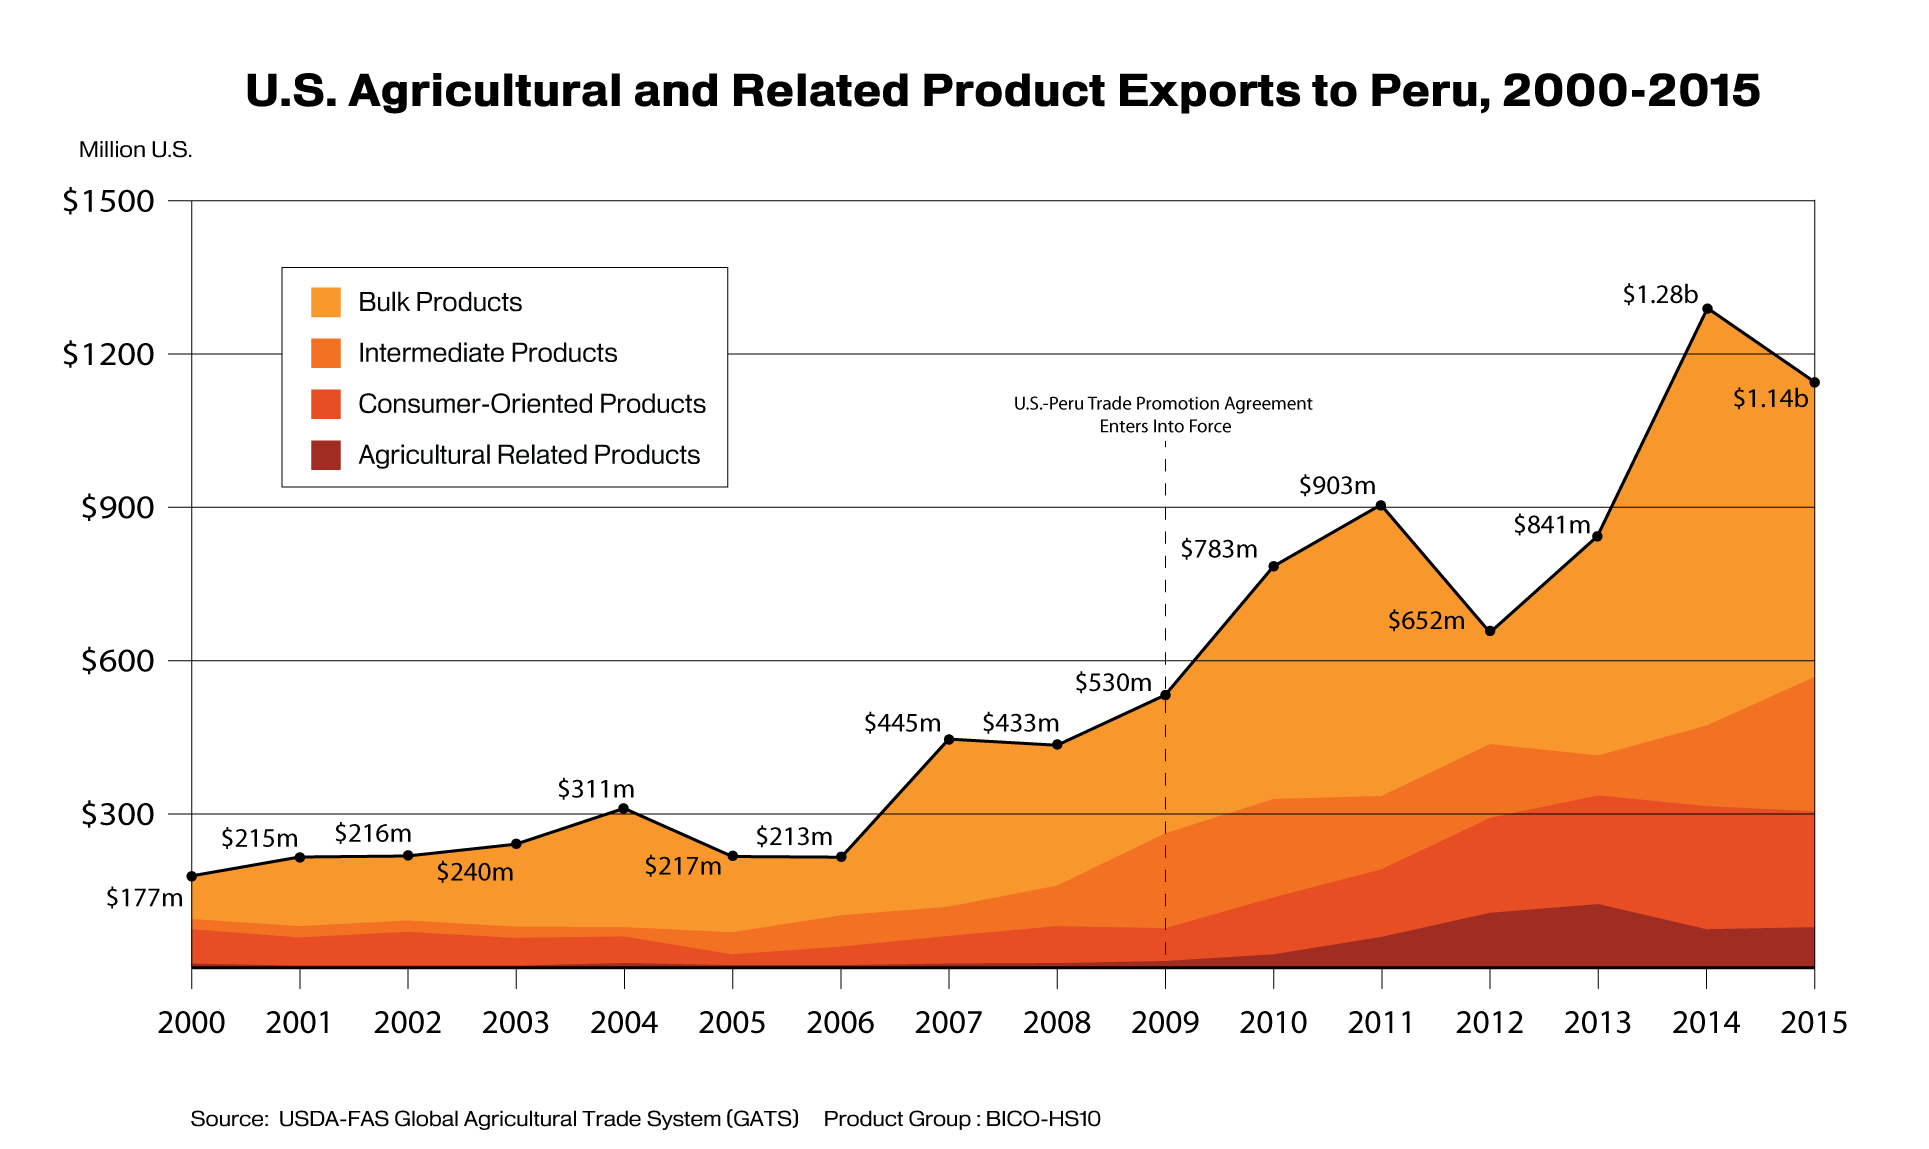
The U.S.-Peru Trade Promotion Agreement entered into force in 2009, cutting agricultural tariffs and improving market access for many U.S. farm and food products. As a result, U.S. agricultural and related product exports to Peru have more than doubled, from $530 million in 2009 to $1.14 billion in 2015.
While bulk commodities still comprise half of U.S. agricultural exports to Peru, the country’s steady economic growth and expanding middle class are fueling demand for higher-value, consumer-oriented products. U.S. exports of consumer-oriented products have grown by more than 500 percent over the past decade, reaching $226 million in 2015. Consumer-oriented products now account for approximately 20 percent of U.S. agricultural exports to Peru. Dairy products, prepared foods and beef comprised almost 55 percent of U.S. consumer products exports to Peru last year. Other top U.S. exports in the consumer-oriented category included chocolate and cocoa products, non-alcoholic beverages, pork, poultry, fresh fruits, tree nuts and pet food.
The United States is Peru’s top supplier of both bulk and consumer-oriented products. In 2015, Peru purchased $575 million of bulk commodities from the United States, of which more than half ($302 million) was corn. Other top bulk commodity export from the United States included cotton, wheat, soybeans and pulses.
In the intermediate products category, the top U.S. exports to Peru are soybean oil and soybean meal, and in the agricultural-related products sector, ethanol is the top U.S. export. U.S. ethanol exports to Peru were valued at $57 million in 2015, up 34 percent from the previous year.

Peru Overview and Outlook
Peru’s economy is greatly influenced by its extractive metals and minerals sector. It is currently the world’s second largest producer of silver and third largest producer of copper. High metal and mineral prices contributed to the expansion of Peru’s economy, enabling it to grow an average of 5.6 percent from 2009-2013. This growth has slowed somewhat with the drop in world prices for metals and minerals. The World Bank ranks Peru third in its “Ease of Doing Business” ratings for the Latin America and Caribbean region.
Peru has a population of about 30.5 million, 40 percent of whom are adults between the ages of 25 and 54. Peru’s middle class is expanding, but large disparities exist between rich and poor households, resulting in differing spending patterns. Consumer spending is forecast to grow at an average annual rate of 4.7 percent through 2030. Currently 36 percent of Peru’s consumer expenditures are on food.
Modern retail food stores are expanding in Peru, and can be found in upper-, middle- and lower-income districts. The majority of these stores are located in Lima, where one third of Peru’s population resides, but demand is driving the expansion of supermarkets in the interior of the country as well.
Ethanol
Peru consumes approximately 165 million liters of fuel ethanol each year, supported by a national mandate that requires gasoline to be blended with 7.8 percent ethanol. By contrast, Chile does not have a national biofuels program and therefore is not a major ethanol market. Peru’s one domestic ethanol plant produces in excess of 125 million liters annually, but more a third of that is shipped to the profitable European market. Peru relies on imported ethanol to fill the resulting gap in supply, with the United States as the primary supplier. USDA estimates that Peru’s ethanol demand will continue to grow by as much as two-three million liters per year, due to the country’s continued economic growth and rising gasoline consumption.
