India’s Agricultural Exports Climb to Record High
Contact:
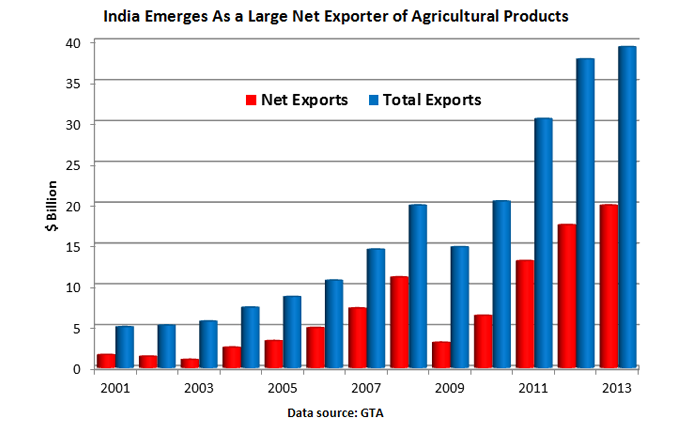
In the past decade, India has emerged as a major agricultural exporter, with exports climbing from just over $5 billion in 2003 to a record of more than $39 billion in 2013. India became the world’s seventh-largest exporter of agricultural products in 2013, surpassing Australia. In terms of net exports, India is now the world’s sixth-largest net exporter, with net exports double those of the EU-28. The Indian government’s support for both production and exports has contributed to the rapid growth in shipments, which are increasingly destined for developing nations including least-developed nations (as classified by the United Nations).

India Leads in Export Growth Rate
India has become a very important player on the global market, especially for rice, cotton, sugar, and beef (buffalo). In addition to these products, India has also become a sizeable exporter of soybean meal, guar gum, corn, and wheat, as well as a diverse range of other products.
| Dramatic Export Increases for Wide Range of Agricultural Products | |||
| Product | 2009 Export Value (Billion USD) | 2013 Export Value (Billion USD) | Increase |
| Rice | $2.4 | $7.1 | +$4.7 |
| Buffalo | $0.9 | $4.0 | +$3.1 |
| Cotton | $1.2 | $3.8 | +$2.6 |
| Soybean Meal | $1.4 | $2.7 | +$1.3 |
| Guar Gum | $0.2 | $2.4 | +$2.2 |
| Corn | $0.5 | $1.2 | +$0.7 |
| Wheat | $0.0 | $1.0 | +$1.0 |
| Other Products | $8.2 | $17.1 | +$8.9 |
| Total | $14.8 | $39.3 | +$24.5 |
| Source: GTA | |||
India’s export growth over the past decade has been the highest of any country, with an annual rate of more than 21 percent. By comparison, Brazil’s annual exports grew 15 percent over the past decade, China’s grew 12 percent and the United States’ grew nine percent. India’s exports so far in 2014 have remained roughly at last year’s record level. From January-May, rice exports are up 10 percent compared to this time last year, cotton up 2 percent, bovine meat (buffalo) up 18 percent, and wheat up 75 percent. Soybean meal, guar gum, and corn exports, however, are down from this time last year.

India’s Exports Benefit from Government Policies and Subsidies
One of the drivers behind India’s export growth has been the dramatic growth in government support provided to agriculture, particular for wheat and rice. Based on official sources, FAS/New Delhi estimates that the Indian government’s total support for agriculture has grown from $68 billion in 2009/10 to $85 billion in 2013/14 (See IN4044). Furthermore, the new government budget recently released indicates that support is likely to reach a new record high in 2014/15 (see IN4064). In addition to supporting irrigation, power, fertilizer, which boosts production for many exported crops such as cotton and sugar, the Indian government provides direct price support to wheat and rice, among other commodities.
Soaring Government Rice and Wheat Stocks Contribute to Record Exports
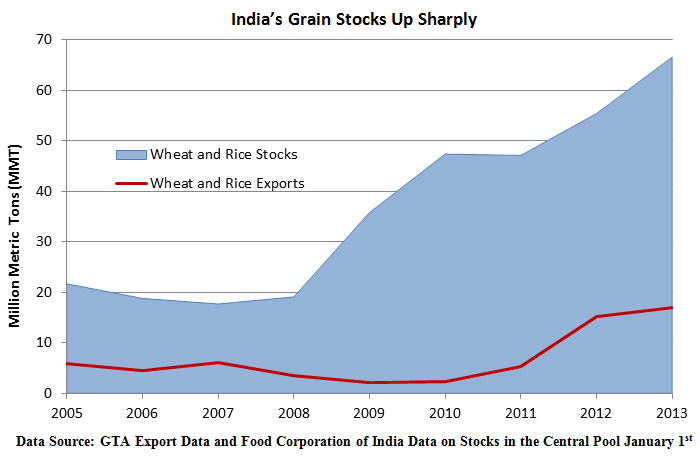
The Indian government purchases rice and wheat directly from farmers at minimum support prices (MSPs). The MSPs for wheat and rice have increased significantly over the past six years, with rice up 75 percent and wheat up 40 percent. These growing MSPs have contributed to expanding production and ballooning government stocks. Exports of these grains have grown, in part, as a result of the government release of these stocks on the domestic market, which lowers prices, making Indian supplies more competitive. Open market sales depress wheat prices more than rice prices due to the volume differences. Exports have also been bolstered, in the case of wheat, through direct exports by the government from government stocks at prices below acquisition and transport costs.

India Trails Only the United States in Cotton Exports
India is estimated to be the world’s second largest cotton exporter in 2013/14 after the United States. India accounts for over one-third of global cotton area, and has seen very large increases in both area and production in the past decade. A major driver of India’s exports is its sizeable stocks of cotton, in addition to very strong demand in China, which accounted for 60 percent of India’s cotton exports in 2013. However, India is a sporadic international supplier and has, in the past, prioritized the domestic market by periodically imposing export bans when domestic prices increase.
India Emerges as a Top Bovine Meat Exporter
India’s exports of meat from bovine animals are estimated to be the second largest in the world after Brazil in 2013 and 2014, and are considerably larger than U.S. beef exports. India’s exports are in the form of water buffalo meat (carabeef), and are very competitively priced. Southeast Asia is the largest market, accounting for 60 percent of India’s exports in 2013. Since India supplies boneless halal cuts, it is very attractive supplier for predominately Muslim countries. As a result, another 32 percent of its exports went to Middle East/North African countries.
Agricultural Exports Increasingly Destined for Developing Countries
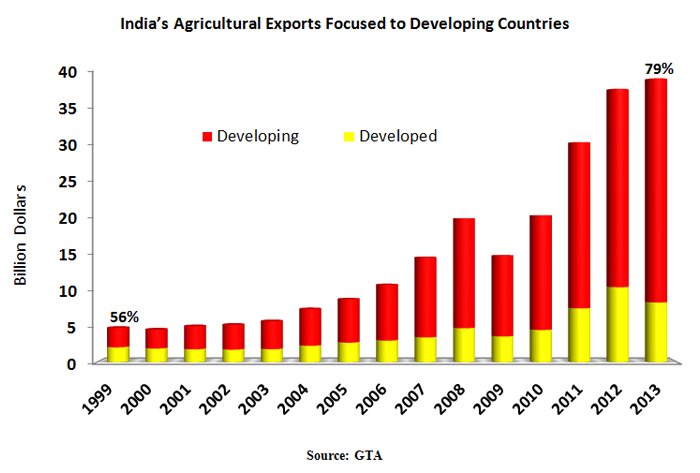
Although the United States has been the largest market for India’s agricultural exports in the past two years (primarily guar gum), nearly all other large markets for India are developing countries. After the United States, the countries that imported at least $1 billion worth of products from India in 2013 were China, Iran, Vietnam, Bangladesh, Saudi Arabia, United Arab Emirates, Indonesia, Malaysia, and Pakistan. In total, 79 percent of India’s exports went to developing markets. Exports have been particularly strong to least developed countries, with India becoming the top supplier in 2013 with $5.2 billion and with a rapidly growing agricultural trade surplus with these nations of $2.4 billion.

