Infographic: International Year of Pulses

  |   Charts and Graphs

(Click graphic to enlarge)

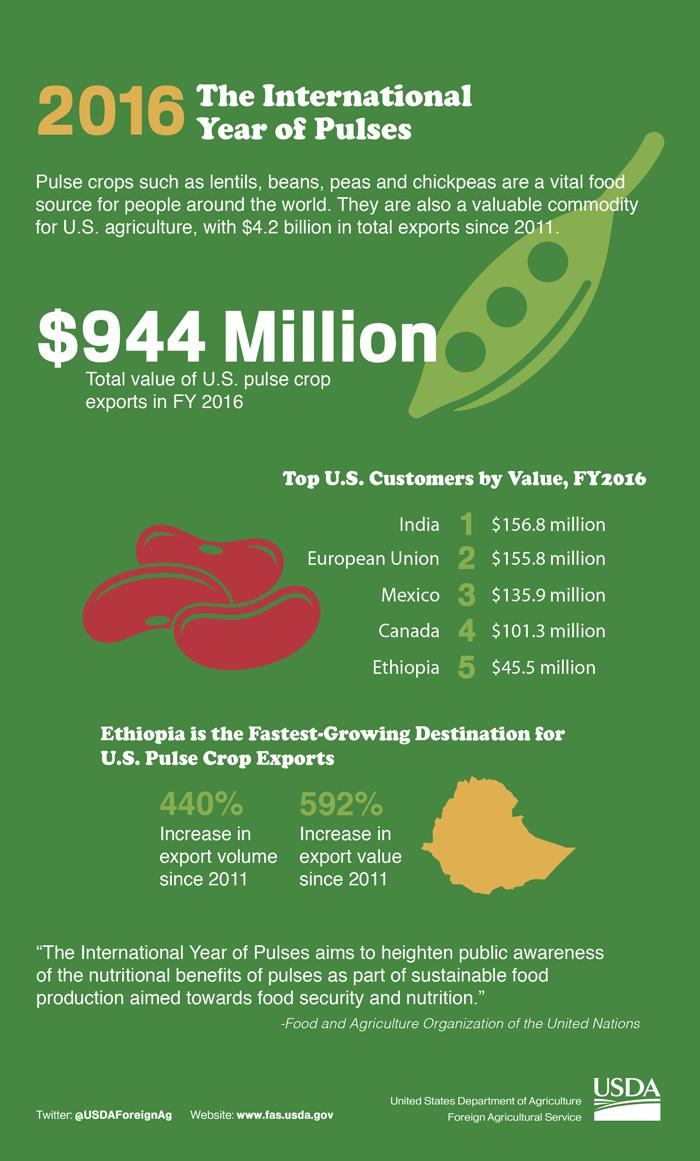
Infographic discussing pulse crops role in sustainable food production and food security, as well as their contributing $944 million to total U.S. ag exports in 2016.

Share this Image On Your Site

<p><strong>Please include attribution to USDA-FAS with this graphic.</strong><br /><br /><a data-cke-saved-href='https://www.fas.usda.gov/data/infographic-international-year-pulses' href='https://www.fas.usda.gov/data/infographic-international-year-pulses'><i… data-cke-saved-src='' src='' alt='2016 International Year of Pulses' width='700px' border='0' /></a></p>

Related Information

2016 International Year of Pulses Official Website

Related Charts & Graphs

Charts and Graphs

2022 U.S. Agricultural Export Facts: Holiday Baking

Infographic discussing holiday baking as it relates to 2022 U.S. agricultural export totals and top producing states.
Infographic showing a series of Halloween themed trivia questions related to U.S. agricultural exports.
Charts and Graphs

USDA Expands Trade and Food Security in 2022

Infographic highlighting Foreign Agricultural Service accomplishments in 2022.