North Asia’s Importance Grows in U.S. and Global Agricultural Markets
Summary
The eight markets of North Asia1 account for just over one-fifth of the world’s population and global GDP. The region’s prominence is even greater in terms of global agricultural trade. North Asia accounts for 28 percent of global agricultural imports. Over the next decade, nearly 40 percent of the global growth in the middle class2 is forecast to occur in North Asia. This increase is expected to further boost demand for agricultural imports. As the top supplier to the region, accounting for 25 percent of the market, the United States is expected to continue as the primary beneficiary of this growth.
North Asia Emerges as Top U.S. Market
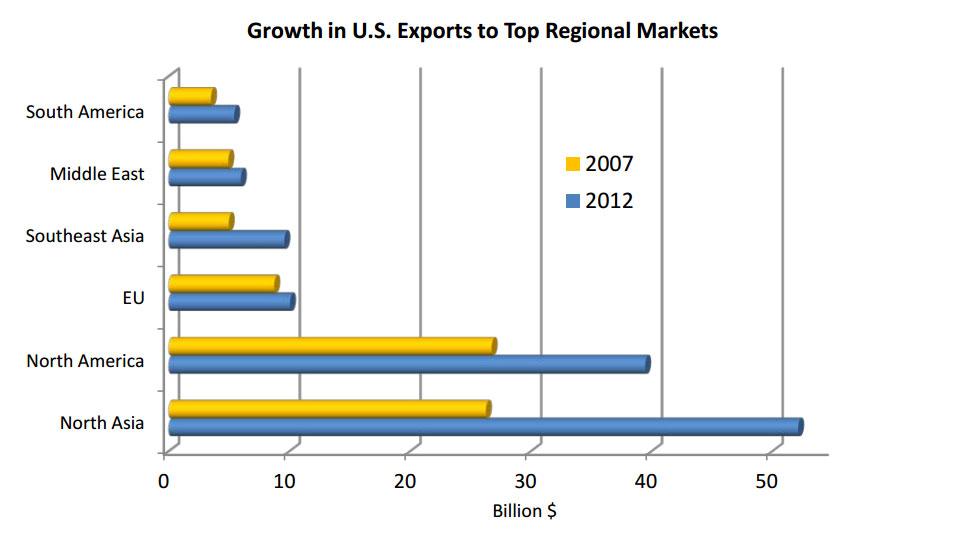
In 2008, North Asia surpassed North America to become the top U.S. regional market and, by 2012, accounted for more than one-third of all U.S. agricultural exports. Despite strong growth in the NAFTA market of Canada and Mexico, North Asia surged to the top regional market largely due to demand from China, Hong Kong, and South Korea.

U.S. agricultural exports to North Asia have doubled over the past five years, reaching a record $52 billion in calendar year 2012. This growth far exceeds the 35-percent growth in total U.S. merchandise exports to the region over the same period. Likewise, growth in agricultural exports to North Asia has surpassed growth in total U.S. agricultural exports to the world. North Asia now accounts for 37 percent of U.S. exports, compared to 29 percent just five years ago. However, U.S. exporters are not the only beneficiaries of strong demand from the region as the total North Asian agricultural import market has soared. North Asian agricultural imports from the world increased over the last five years from an estimated $114 billion to $227 billion.
[[{"fid":"127","view_mode":"large","fields":{"format":"large","field_file_image_alt_text[und][0][value]":"Chart showing North Asian agricultural imports","field_file_image_title_text[und][0][value]":"Chart showing North Asian agricultural imports","field_keywords[und]":"IATR, june, 2013"},"type":"media","link_text":null,"attributes":{"height":419,"width":700,"class":"media-element file-large"}}]]
U.S. Export Growth Focused in Bulk Shipments
A notable development in U.S. agricultural exports over time is the increased importance of consumer-oriented products as a percentage of total exports. In recent years, North Asia has defied this trend. Consumer-oriented products, as a percentage of total agricultural exports to this region, have fallen in importance while bulk commodities have increased. The share of consumer-oriented agricultural products now stands at 30 percent, down from 41 percent 10 years ago. By contrast, bulk commodities now account for 56 percent of U.S. agricultural products to the region as compared to 40 percent ten years ago. Despite the falling share, consumer-oriented exports to North Asia more than doubled in value over the past decade, from $6.7 billion in 2002 to $15.5 billion in 2012. Japan is the top consumer-oriented market in the region but percentage growth is the largest in China with an increase of 740 percent since 2002.

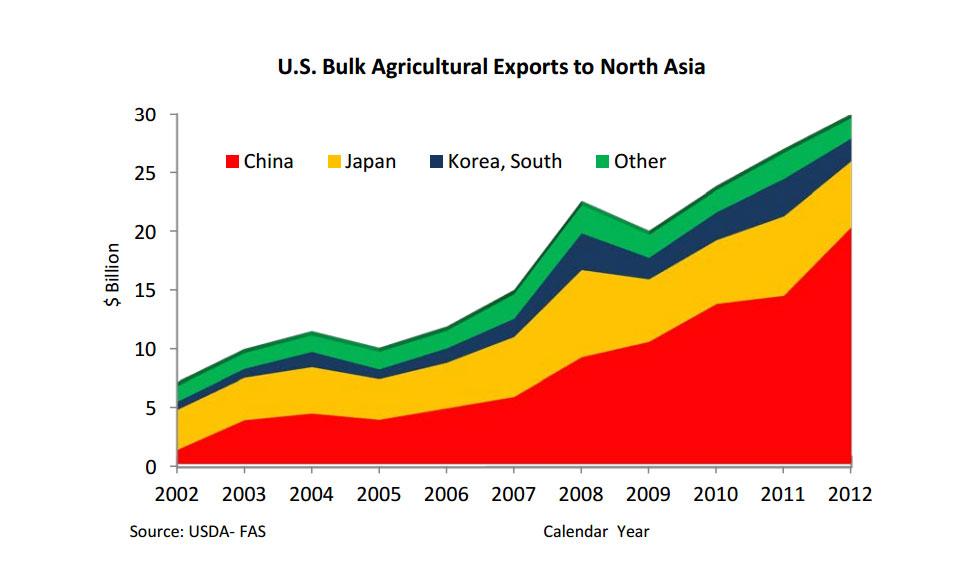
Much of the increase in bulk shipments is a result of soaring demand from China, which accounts for more than two-thirds of total U.S. bulk exports to the region. In fact, bulk commodity exports to China have grown from just $1 billion in 2002 to $20 billion in 2012. Much of this growth stems from greater Chinese demand for soybeans, though corn and cotton exports have also surged in recent years. Meanwhile, exports of corn to Japan, along with wheat and corn to South Korea, have grown over the past decade. Given expected continued gains in per-capita meat consumption in the region (particularly in China), import demand for grains and soybeans should continue to expand. In fact, according to USDA 10-year baseline projections, U.S. corn exports to the major markets in North Asia should increase from 29 percent of total U.S. corn shipments in 2011/12 to 36 percent by 2022/2023. Currently, more than half of all U.S. bulk exports to the world are shipped to North Asia and this share is likely to increase further.
North Asia’s Role in Global Trade Grows
In 2012, total North Asian agricultural imports from all global suppliers reached a record $227 billion, compared to $63 billion a decade earlier. The region’s impact on agricultural trade is clearly focused on import demand as North Asia comprises an estimated 28 percent of global agricultural imports. However, the region is also a growing exporter, with shipments reaching $59 billion in 2012.
North Asian agricultural exports (primarily horticultural products) to the United States increased over the past decade from less than $2 billion to nearly $6 billion. Despite this growth, the region remains a relatively small supplier of U.S. agricultural imports. However, trade within the North Asian region has grown even more and, as a result, production shortfalls are keenly felt in neighboring countries.China accounts for 73 percent of the region’s exports. Shipments from China to other North Asian markets have increased significantly in the past several years, with $15.5 billion being exported in 2012 – up 45 percent from just five years earlier.Japan is the top destination for Chinese exports, with Hong Kong and South Korea ranking as the third- and fourth-largest markets. Growth in Chinese exports to North Korea has also been impressive, increasing over the past decade from $81 million to $337 million.
Economic Growth to Spur Future Import Demand
North Asia’s importance to U.S. agriculture is expected to continue to grow in the future as growth in the middle class spurs ever-increasing import demand. Led by China, further gains in per capita meat consumption are expected, as is demand for high-value products such as almonds, dairy products, and a wide variety of processed food and beverages. Given limited land resources, importers in the region are expected to continue to rely on U.S. products to meet growing demand not only for bulk products but for processed foods as well.
1North Asia includes Japan, China, South Korea, North Korea, Hong Kong, Taiwan, Mongolia, and Macau
2Source: Global Insight - households with real purchasing power parity (PPP) incomes greater than $20,000/year
