Opportunities for U.S. Agricultural Products in Guatemala
Contact:
Link to report:

Executive Summary
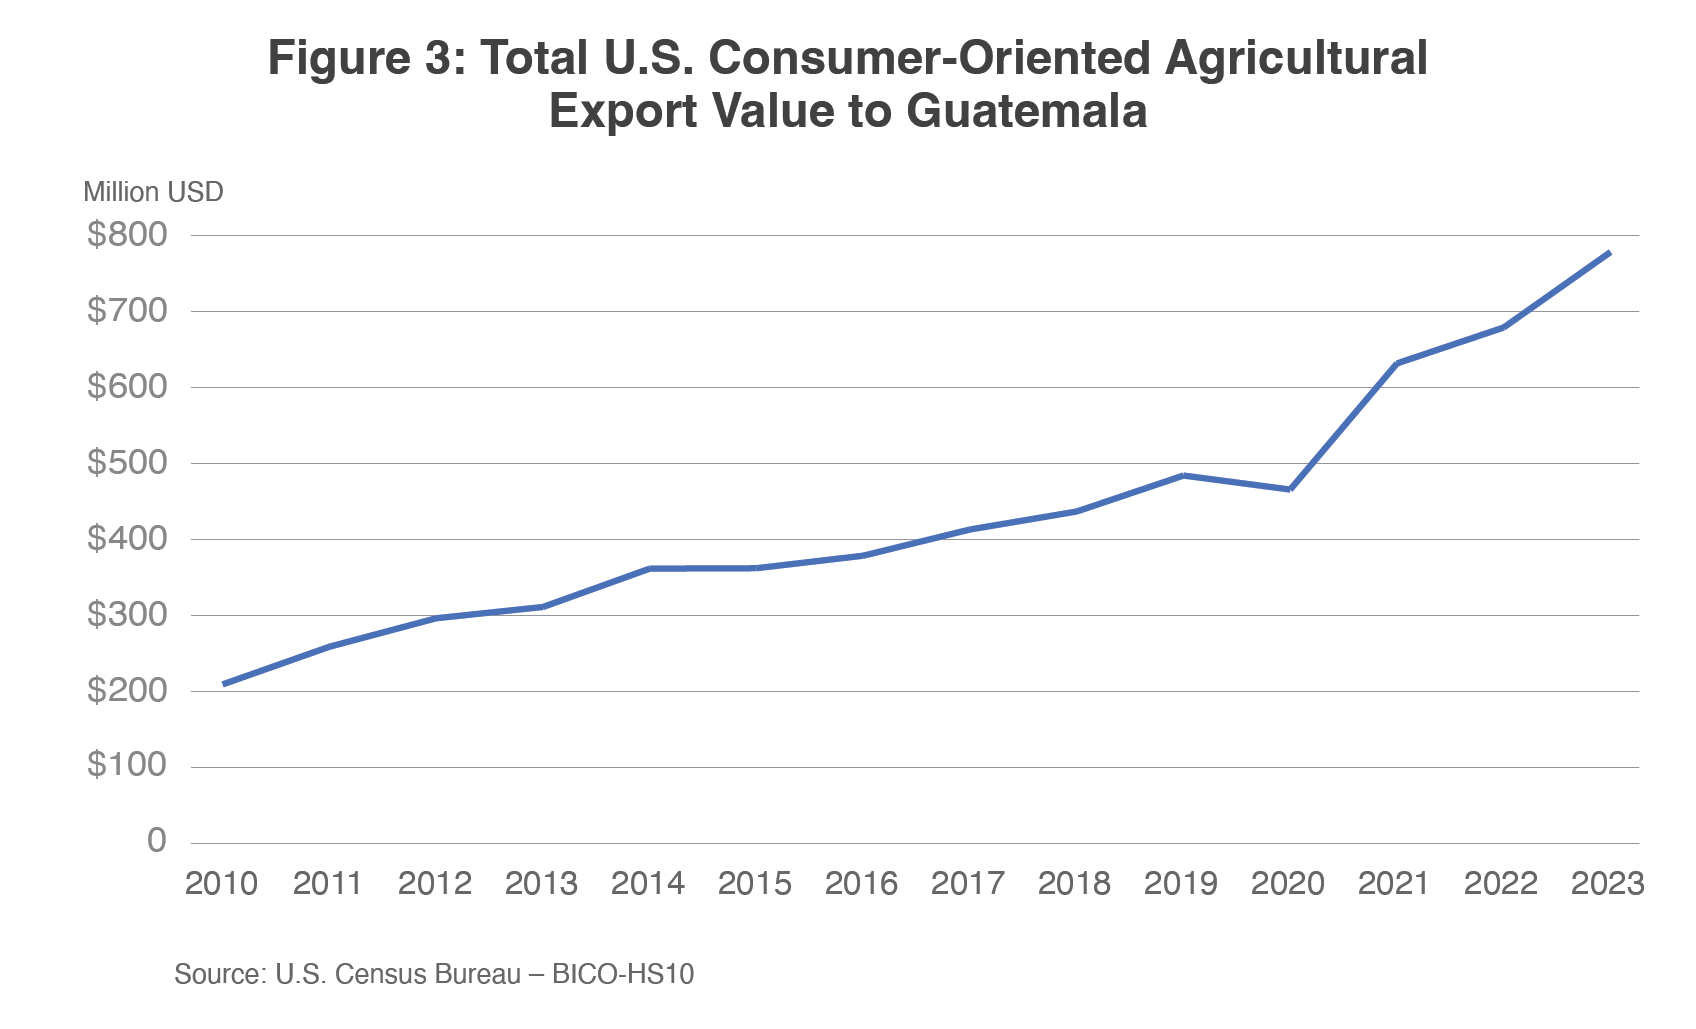
U.S. agricultural exporters of consumer-oriented products are well-positioned to increase sales to Guatemala. In 2023, U.S. consumer-oriented export values reached a third-consecutive record on 15 percent growth from the previous year (Figure 3). Additionally, consumer-oriented products make up more than half (57 percent) of Guatemala’s agricultural imports worldwide. With the support of Guatemala’s growing economy, benefits from the Dominican Republic-Central America Free Trade Agreement (CAFTA-DR), and consumers’ shift toward high-value products, U.S. consumer products remain competitive in the Guatemalan agricultural import market. Products with growth and potential for U.S. consumer-oriented agricultural exports include (1) poultry and meat products (excluding eggs), (2) dairy products, (3) pork and pork products, (4) soup and food preparation, (5) processed vegetables, (6) beef and beef products, (7) condiments and sauces, (8) fresh fruit, (9) bakery goods, cereals, and pasta, (10) processed vegetables, and (11) alcoholic beverages (wine and distilled spirits).
Macroeconomic Perspective of Guatemala
Guatemala, with a population approaching 18 million, is the largest economy in Central America (excluding Mexico). Following a decade of strong gross domestic product (GDP) growth, Guatemala’s economy is on trend to grow 3.5 percent in 2024 and 3.1 percent in 2025, driven by global Guatemalan export demand and private consumer spending supported by strong remittance inflows from the United States. Remittances make up nearly 20 percent of Guatemala’s GDP. However, Guatemala faces headwinds from increasing inflation expectations and disruptions related to natural disasters. The country also continues to struggle with high poverty rates, income inequality, and underdeveloped infrastructure, which could pose hurdles to sustained economic growth.
Guatemala’s Agricultural Trade Overview
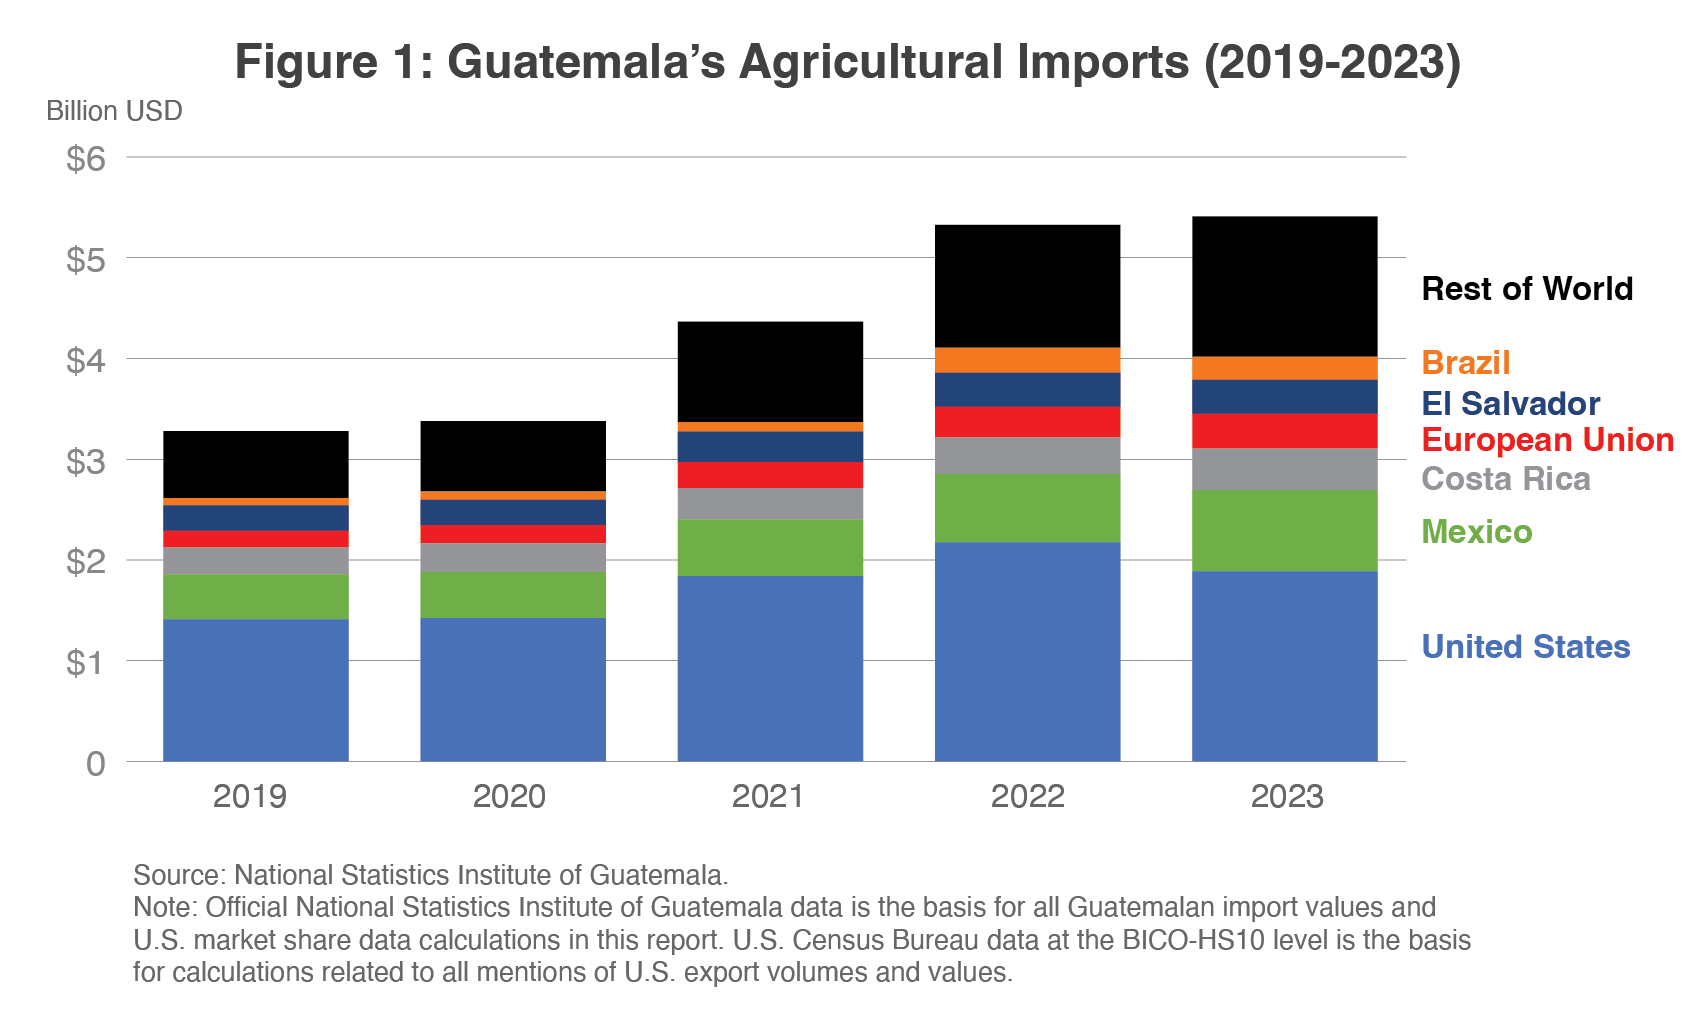
In 2023, Guatemala was the 15th-largest market for U.S. agricultural exports, with total exports reaching $1.6 billion. Top U.S. agricultural exports include corn ($271 million), soybean meal ($270 million), poultry meat and products excluding eggs ($193 million), and dairy products ($111 million). As shown in Figure 1 (see first page), the United States is the top supplier of agricultural products, followed by Mexico and Costa Rica. While the Guatemalan economy continues to grow and U.S. products remain competitive, consumer-oriented products will continue to provide growth opportunities for U.S. exports.

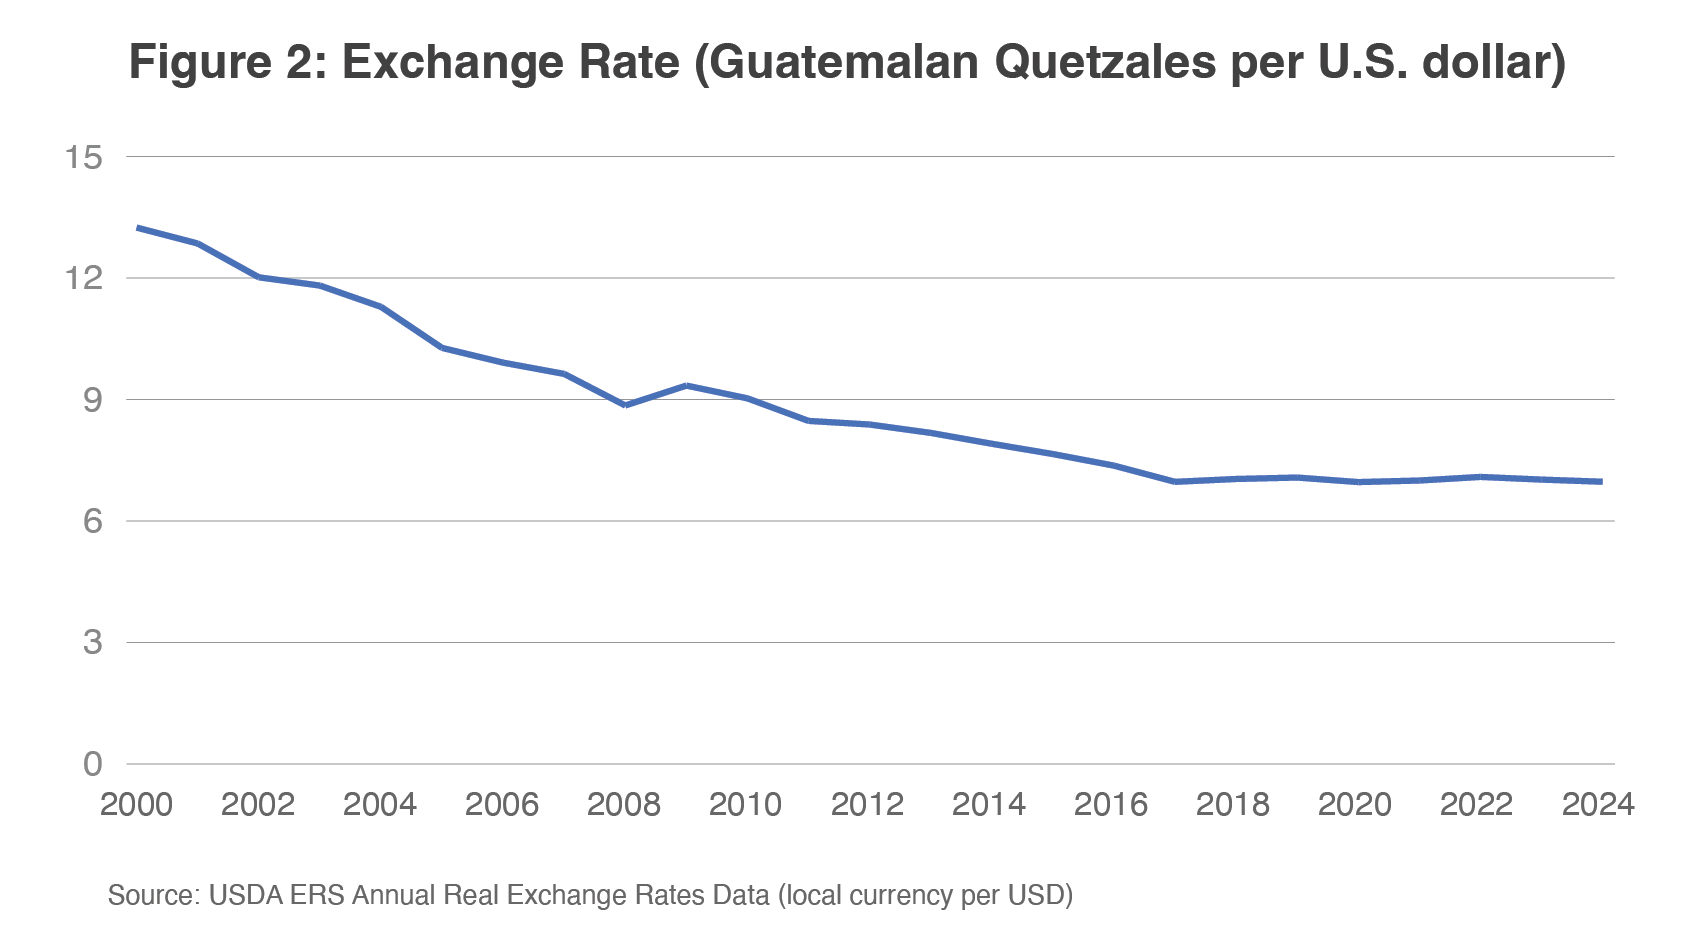
During the last 25 years, the Guatemalan quetzal has appreciated against the U.S. dollar, increasing purchasing power for Guatemalan consumers and making U.S. agricultural products more competitive in the domestic market. As shown in Figure 2, the exchange rate has been relatively flat and low since 2017. In 2024, the U.S. dollar continues to perform strongly against many global currencies and is on trend to appreciate by 0.9 percent globally (link). However, the U.S. dollar is on trend to depreciate slightly against key agricultural trading competitors, including the Euro and Brazilian real.

Figure 3 shows how consumer-oriented products in Guatemala have consistently been an area of growth for U.S. agricultural exports. Since 2010, U.S. consumer-oriented agricultural exports to Guatemala have reached a new record in 13 of the past 14 years, with the only exception being 2020, due to the COVID-19 pandemic. The CAFTA-DR agreement, which the United States and Guatemala entered in 2006, immediately boosted U.S. agricultural products. As seen in Table 1, the 3-year average of U.S. agricultural exports to Guatemala following the agreement’s implementation increased by 93 percent compared to the 3-year average prior to the agreement.
Table 1: Before and After CAFTA-DR Implementation (2006): Comparing 3-year Averages
| Before CAFTA-DR Implementation: Average exports (2003-05) | After CAFTA-DR Implementation: Average exports (2007-09) | Percentage change | |
| U.S. Agricultural Exports to Guatemala | $406 million | $781 million | +93 percent |
Source: U.S. Census Bureau – BICO-HS10
Following the implementation of the CAFTA-DR, Guatemala eliminated nearly all tariffs on U.S. agricultural products entering the country, with a few remaining tariffs set for Guatemala to phase out by 2025. As of 2024, 10 out of the 11 U.S. products below face no tariffs, further enhancing their market prospects. Even 18 years after implementation, with rising incomes, urbanization, and changing preferences, new opportunities still arise for U.S. agricultural exports, specifically for consumer-oriented products.
Opportunities for U.S. Agricultural Exports
I. Poultry Meat and Products (excluding eggs)
Total 2023 Guatemalan Import Value: $201 Million
U.S. Market Share: 98 Percent
On a volume basis, chicken accounts for nearly all Guatemalan poultry meat imports, with the rest being mostly turkey meat. Guatemala’s chicken production satisfies about three-fourths of domestic consumption, while imports satisfy the remaining quarter. The United States accounts for nearly all Guatemalan chicken imports, primarily frozen chicken leg quarters, with additional small volumes imported from neighboring Central American countries. During the past 5 years, the value of U.S. poultry exports to Guatemala has grown every year, except for 2020, when the COVID-19 pandemic shock greatly impacted global consumption and trade. In 2023, import values of U.S. poultry meat and products grew to a record at $193 million, up 10 percent from the year before. U.S. exports to Guatemala benefited from the elimination of duties on fresh, frozen, and chilled U.S. chicken leg quarters in 2017, 5 years ahead of the CAFTA-DR schedule. Additionally, U.S. exports further benefited from a June 2022 policy change that allowed the U.S. Department of Agriculture (USDA) to certify full pallets of poultry exports instead of breaking down pallets to stamp each box individually, according to a USDA Global Agricultural Information Network (GAIN) report (link). Streamlining export procedures drove down logistics costs, helping to offset elevated unit values and keep Guatemalan purchases of U.S. poultry strong.
II. Dairy Products
Total 2023 Guatemalan Import Value: $448 Million
U.S. Market Share: 27 Percent
Dairy products account for the second-highest global consumer-oriented agricultural import value in Guatemala. In 2023, the United States was the largest dairy product supplier to Guatemala, accounting for more than a quarter of import values. Driven by a double-digit increase in export volumes in the past 3 years, the United States grew its market share in Guatemala from 17 percent in 2020 to 27 percent and a record $111 million in 2023. The United States was the leading supplier of cheese, whey products, and yogurt in 2023, with more than 50 percent market share in each category. The United States competes in Guatemala with other dairy producers like New Zealand (butter and milks and creams), Costa Rica (milks and creams), Mexico (infant formula and buttermilk), the European Union (malt and cheese), and El Salvador (cheese, buttermilk, and ice cream). Overall, dairy product imports have grown the past few years in Guatemala, and the United States has supplied a larger share of this growing market.
III. Pork and Pork Products
Total 2023 Guatemalan Import Value: $114 Million
U.S. Market Share: 93 Percent
Growth in Guatemala’s pork imports outpaced domestic production gains during the past two decades, resulting in import volume overtaking production tonnage in 2021. Guatemala imports mostly frozen pork meat, offal, and hams. The United States accounts for nearly all Guatemalan pork imports, with additional volumes mostly purchased from Mexico and the European Union. In 2023, import values of U.S. pork meat and products grew to a record at $103 million, up 29 percent from the year before. Guatemala’s pork consumption has room for additional growth. According to Food and Agriculture Organization data, Guatemala has the lowest pork consumption per capita in Central America, well below Costa Rica and Panama. If prices remain affordable to consumers, U.S. pork exports to Guatemala should continue to grow.
IV. Soup and Other Food Preparations
Total 2023 Guatemalan Import Value: $482 Million
U.S. Market Share: 19 Percent
Soups and other food preparations account for the highest import value in Guatemala among all consumer-oriented agricultural products from all sources. The United States is the second-largest exporter to Guatemala, behind Costa Rica, which accounted for 37 percent of the market in 2023. Like many of the other consumer-oriented products, U.S. export values to Guatemala reached a record for the third consecutive year, owing to strong Guatemalan import demand growth. According to the CAFTA-DR agreement between Guatemala and the United States, Guatemala has entirely phased out tariffs on soup and other food preparations from the United States.
V. Processed Vegetables
Total 2023 Guatemalan Import Value: $180 Million
U.S. Market Share: 50 Percent
In 2023, the United States was the largest processed vegetable supplier to Guatemala, accounting for half of import values. Driven by volume gains in 2021 and higher export unit values in the past 2 years, the United States reached record processed vegetable exports to Guatemala for the third consecutive year in 2023 at $70 million, with potato and French fries, tomato pastes and purees, and sweet corn accounting for most of the value. The United States competes with other exporters in Guatemala like China (dried and frozen vegetable mixtures, onions, and mushrooms), El Salvador (beans), the European Union (potatoes, olives, and starches), Chile (tomato pastes and purees), and Mexico (potatoes).
VI. Beef and Beef Products
Total 2023 Guatemalan Import Value: $151 Million
U.S. Market Share: 51 Percent
In 2023, Guatemalan beef and beef product imports from the United States were up 24 percent from the previous year. The United States is the top supplier of beef and beef products and competes with Nicaragua, Costa Rica, and the Dominican Republic. As a net beef importer, Guatemala relies on imports to meet domestic demand. In this market, U.S. high-end cuts – such as T-bone, tomahawk, and ribeye – are popular in specialty meat stores, hotels, and restaurants (link). U.S. beef has also benefited significantly from the CAFTA-DR agreement. After the agreement eliminated tariffs on U.S. beef and beef products in 2020, beef imports from the United States surged by 68 percent in 2021.
VII. Condiments and Sauces
Total 2023 Guatemalan Import Value: $167 Million
U.S. Market Share: 23 Percent
Condiments and sauces rank as Guatemala’s 11th-largest import, showing consistent year-over-year growth for the past decade. The United States is Guatemala’s third largest supplier, behind Costa Rica and Mexico. The top Guatemalan condiment and sauce imports are mixed condiments, mixed seasonings, and ketchup. Thanks to CAFTA-DR, U.S. condiments and sauces enter Guatemala tariff-free. U.S. exporters have market opportunities in the organic market sector as more Guatemalans adopt healthier eating habits and seek products with reduced sugar, saturated fats, and cholesterol.
VIII. Fresh Fruit
Total 2023 Guatemalan Import Value: $108 Million
U.S. Market Share: 33 Percent
Although Guatemala is a net exporter of fresh fruits like bananas, melons, and plantains, it imports fruits it doesn’t domestically produce. Top imports include fresh apples, grapes, and pears. In 2023, fresh fruit imports from all sources rose to $108 million, up from $98 million in 2022. The United States is the leading supplier, followed by Chile, Peru, and the European Union. Since 2020, U.S. fresh fruits have not faced tariffs due to CAFTA-DR. According to a USDA GAIN report (link), open-air markets sell imported fruits, including grapes, apples, pears, nectarines, and tangerines, year-round and in larger amounts during the Christmas season.
IX. Bakery Goods, Cereals, and Pasta
Total 2023 Guatemalan Import Value: $320 Million
U.S. Market Share: 10 Percent
In 2023, Guatemala imported $320 million of bakery goods, cereals, and pasta, marking a 12-percent increase from the previous year. Key imports include pastries, prepared foods with cereal products, cookies, and pasta. El Salvador is the top supplier in this category, followed by Mexico and Honduras. According to Euromonitor, demand for indulgent snacks, such as sweet biscuits (cookies), continues to rise, alongside strong interest in healthier alternatives. Although the United States holds a 10-percent market share, it is experiencing growth in this sector.
X. Chocolate and Cocoa Products
Total 2023 Guatemalan Import Value: $71 Million
U.S. Market Share: 34 Percent
In 2023, Guatemala imported $71 million worth of chocolate and cocoa products, a 9-percent increase from the previous year. The United States remains the top supplier of chocolate products, followed by Mexico and the European Union. According to Euromonitor, premium chocolate varieties made with high-quality ingredients will continue to perform strongly in Guatemala’s market in 2024. Health and wellness trends have also driven consumer interest in cacao-rich dark chocolates and products with organic ingredients, less sugar, and fewer or no artificial additives. Thanks to the CAFTA-DR agreement, it eliminated all tariffs on U.S. chocolate and cocoa products.
XI. Alcoholic Beverages: Distilled Spirits and Wine and Related Products
Total 2023 Guatemalan Import Value for Distilled Spirits: $37.1 Million
U.S. Market Share: 5 Percent
Total 2023 Guatemala Import Value for Wine and Related Products: $21.0 Million
U.S. Market Share: 12 Percent
Alcoholic beverages present strong opportunities in the Guatemalan market, particularly in wine and distilled spirits. The United States competes with the European Union and Chile in the wine sector and with the United Kingdom, Mexico, and the European Union in the distilled spirit market. The top imported distilled spirits include whiskies, liqueurs, and cordials, while leading wine imports consist of sparkling wine, wine made from fresh grapes, and vermouth. U.S. wine and distilled spirit products have gained strong momentum in Guatemala.
Export Requirements and Challenges
While U.S. exporters see plentiful opportunities in the Guatemalan market, they should be mindful of requirements and challenges related to labeling requirements, competition from other countries, and transportation infrastructure. According to the USDA Food and Agricultural Import Regulations and Standards Country Report on Guatemala (link), U.S. processed products must meet specific labeling requirements. The labels should include a description, net weight/volume, list of ingredients, form of preparation, expiration date, registration number, country of origin, importer information, and radiation information. Labels must be clear, informative, not misleading, and must avoid making false claims. For individually packaged products that are too small for a label, the label is required on the outer packaging.
U.S. exporters also face intense competition due to Guatemala’s free trade agreements with other countries. For example, Guatemala signed a free trade agreement with Mexico in 2011 and with the European Union in 2012, both of which created competitive pressure. Other countries that signed a free trade agreement include Chile, Taiwan, Panama, United Kingdom, Colombia, and other CAFTA-DR members (link). Guatemala is also negotiating a trade agreement with Canada, further intensifying the competitive landscape. Despite the possibility of increased competition from additional free trade agreements, the United States still has a geographical advantage compared to European and Asian competitors that reduces shipping times and costs. However, many Guatemalan importers prefer consolidated shipments to reduce transportation costs, which requires increased cost and coordination from exporters to consolidate shipments in Miami. Additionally, Guatemala’s underdeveloped roads and transportation infrastructure present logistical challenges, particularly for reaching certain markets, which leads to higher transportation costs. U.S. exporters should avoid shipping products nearing the end of their shelf life, as delays could impact product viability. Furthermore, Guatemalan consumers are price sensitive and may switch to competitor products if they perceive U.S. goods as too expensive.
Guatemala’s Demographics and Consumer Trends

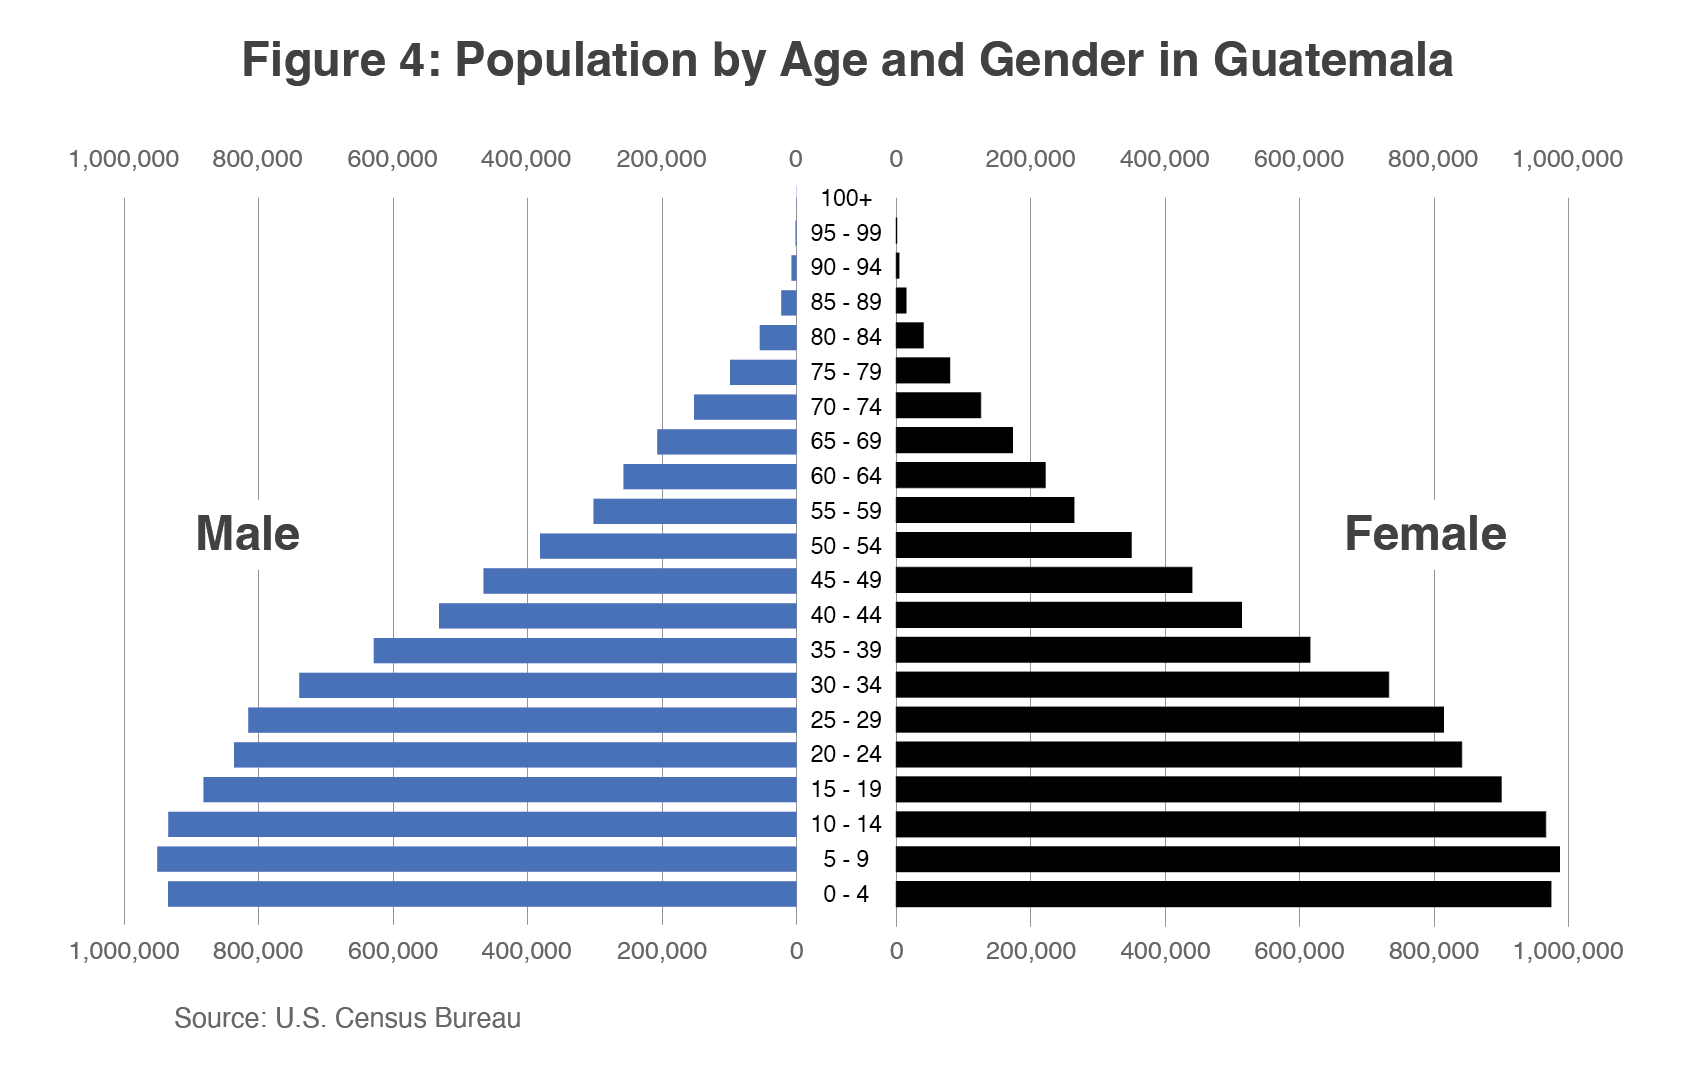
The Central Intelligence Agency World Factbook (link) reported that Guatemala is the most populous country in Central America and has the highest fertility rate in Latin America. Guatemala has a population of approximately 18 million people, with a median age of 25. Nearly half of Guatemala’s population is below age 19, making it the youngest population in Latin America. Most Guatemalans reside in the southern half of the country, specifically in mountainous regions. The USDA Exporter Guide (link) notes that income distribution strongly influences market conditions. Consumer tastes and purchasing decisions differ between urban and rural Guatemalans. Overall, food preferences have shifted toward high-value food products. The United States exposes Guatemalan travelers to U.S. food products, which they view as high quality. Additionally, Guatemalans have been seeking healthy food options with reduced sugar, saturated fats, and cholesterol in their food.
Conclusion
Consumer-oriented products continue to present opportunities as the Guatemalan economy grows and Guatemalan consumers seek high-value products. Strategically located in Central America, Guatemala benefits from seaport access to both the Atlantic and Pacific Oceans, facilitating trade. Furthermore, most U.S. imports face no tariffs, increasing the competitiveness of U.S. products in the Guatemalan market. Based on trade agreements, existing relationships, and geographical advantages, the United States should continue to have a strong market share of growing Guatemalan demand for consumer-oriented agricultural products.
Resources:
U.S. Soybean Export Council Market Snapshot: Guatemala
https://ussec.org/wpcontent/uploads/2024/02/USSEC_Country_Market_Snapshot_2024_V2_Guatemala.pdf
World Bank Macro Economic Overview
https://www.worldbank.org/en/country/guatemala/overview
Exporter Guide Annual Report 2024: Guatemala
Guatemala’s Poultry Import Policy Change
