A Review of U.S. Tariff Rate Quotas for Beef Imports
Contact:
The United States is the world’s largest producer of beef but it also imports more beef than any other country. U.S. producers specialize in raising high-value, grain-fed cattle, while the beef the United States imports from other countries is mainly lower-value, grass-fed, lean product that is processed into ground beef. Overall, imports accounted for nearly 14 percent of U.S. beef supplies in 2015.
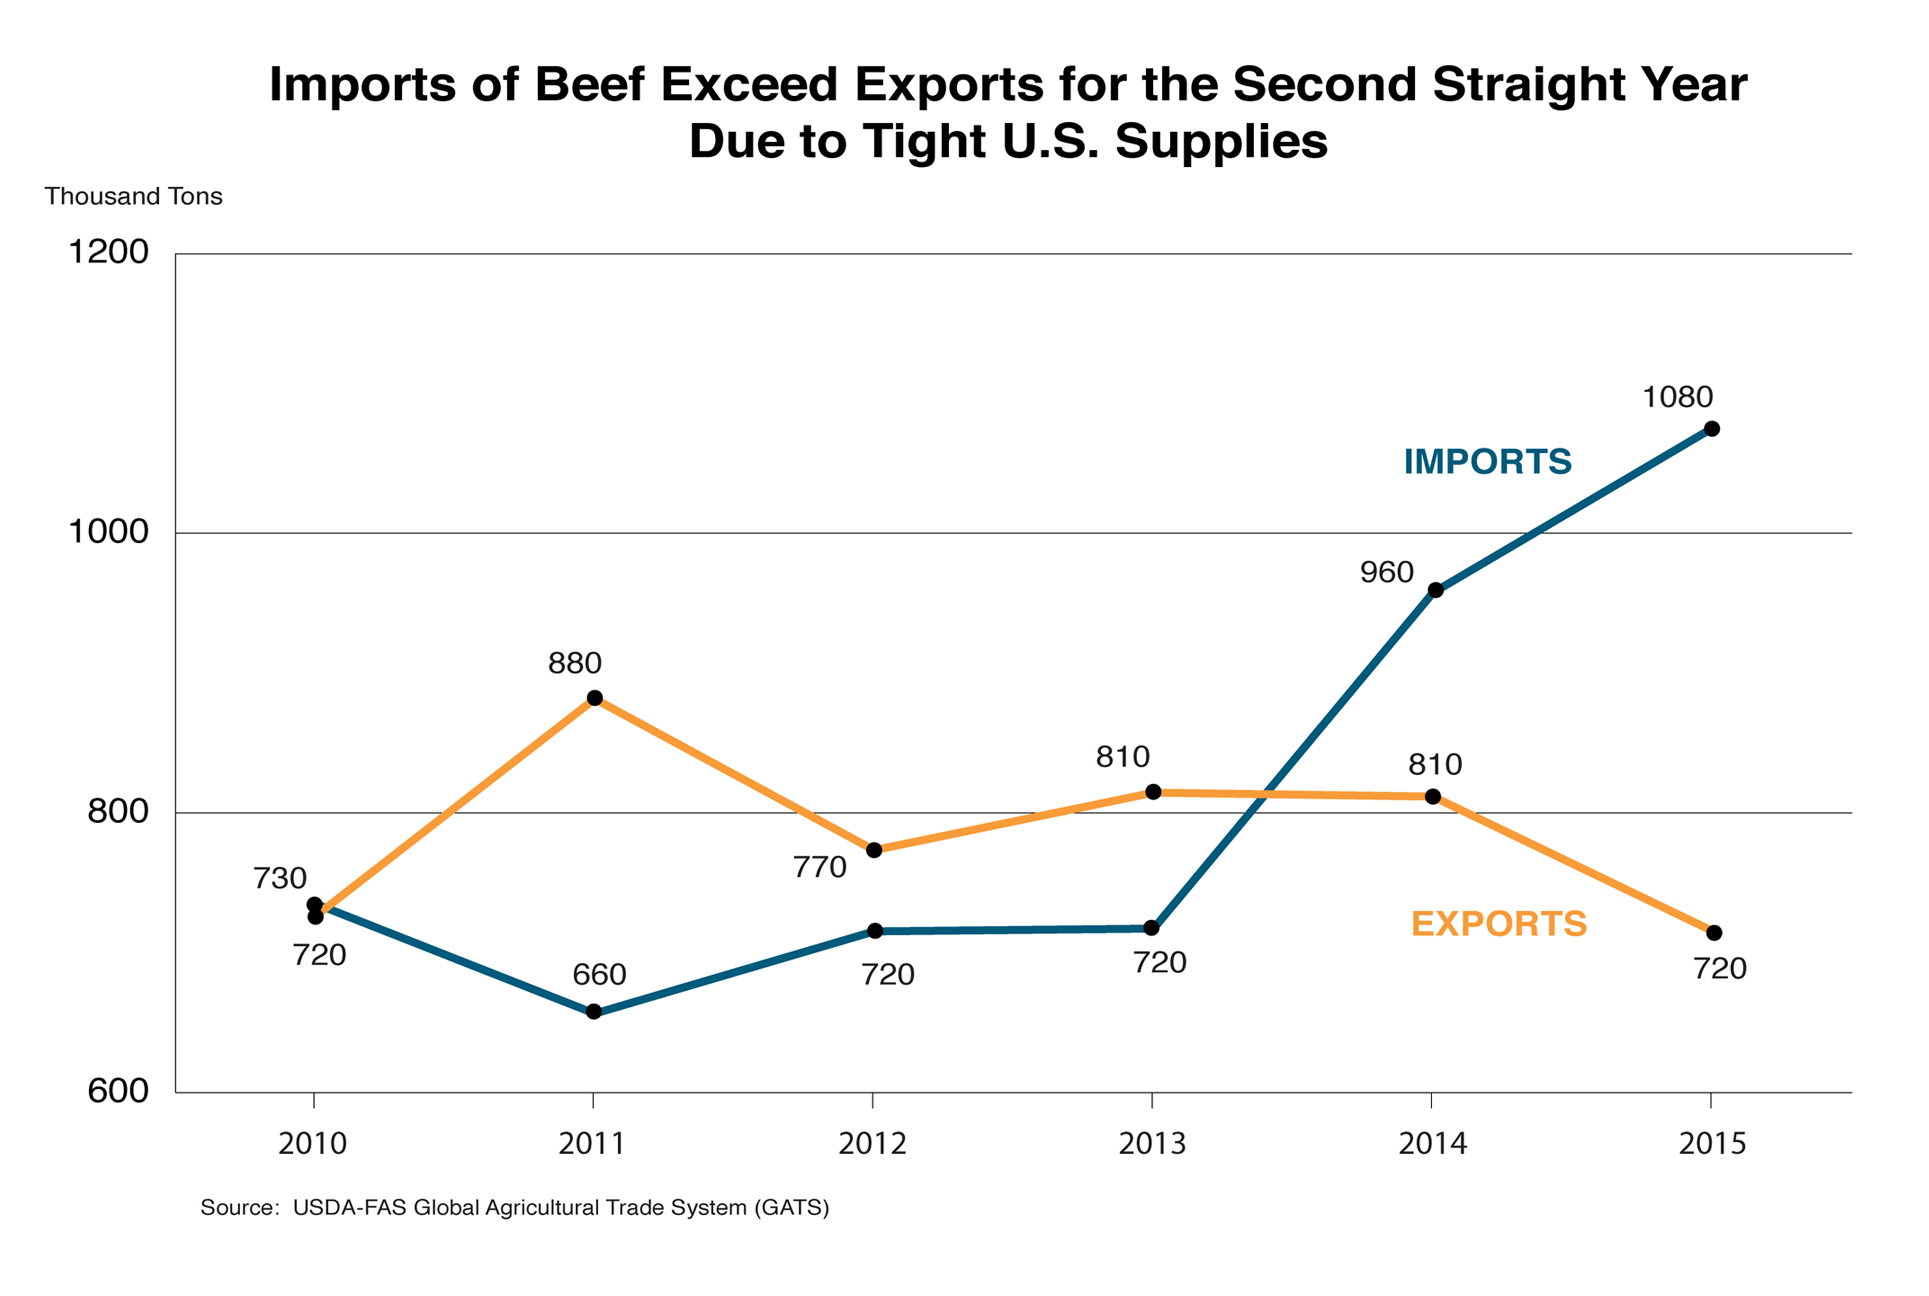
From 2011-2013, the United States was a net exporter of beef on a volume basis. However, imports surpassed exports in 2014 when domestic production declined nearly six percent. Falling production was triggered by severe drought in the Southern Plains states, as well as high feed prices that caused farmers to reduce their herds between 2009 and 2014. Reductions in the cow inventory led to lower production of lean (non-grain-fed) beef, increasing demand for lean processing meat. Rising imports of both processing beef and table cuts through 2015 have offset some, but not all, of the lower production. Expansion in the cattle sector began in 2014, spurred by high cattle prices and improved forage conditions in late 2014. U.S. beef production is forecast to increase in 2016 and lessen demand for imported beef.
U.S. beef imports totaled $6.2 billion (1.1 million tons product weight) in 2015 and exports totaled $5.2 billion (716,000 tons). The gap between imports and exports is expected to narrow in 2016 as higher U.S. beef supplies support increased exports and decreased imports.

Top Suppliers of Imported Beef
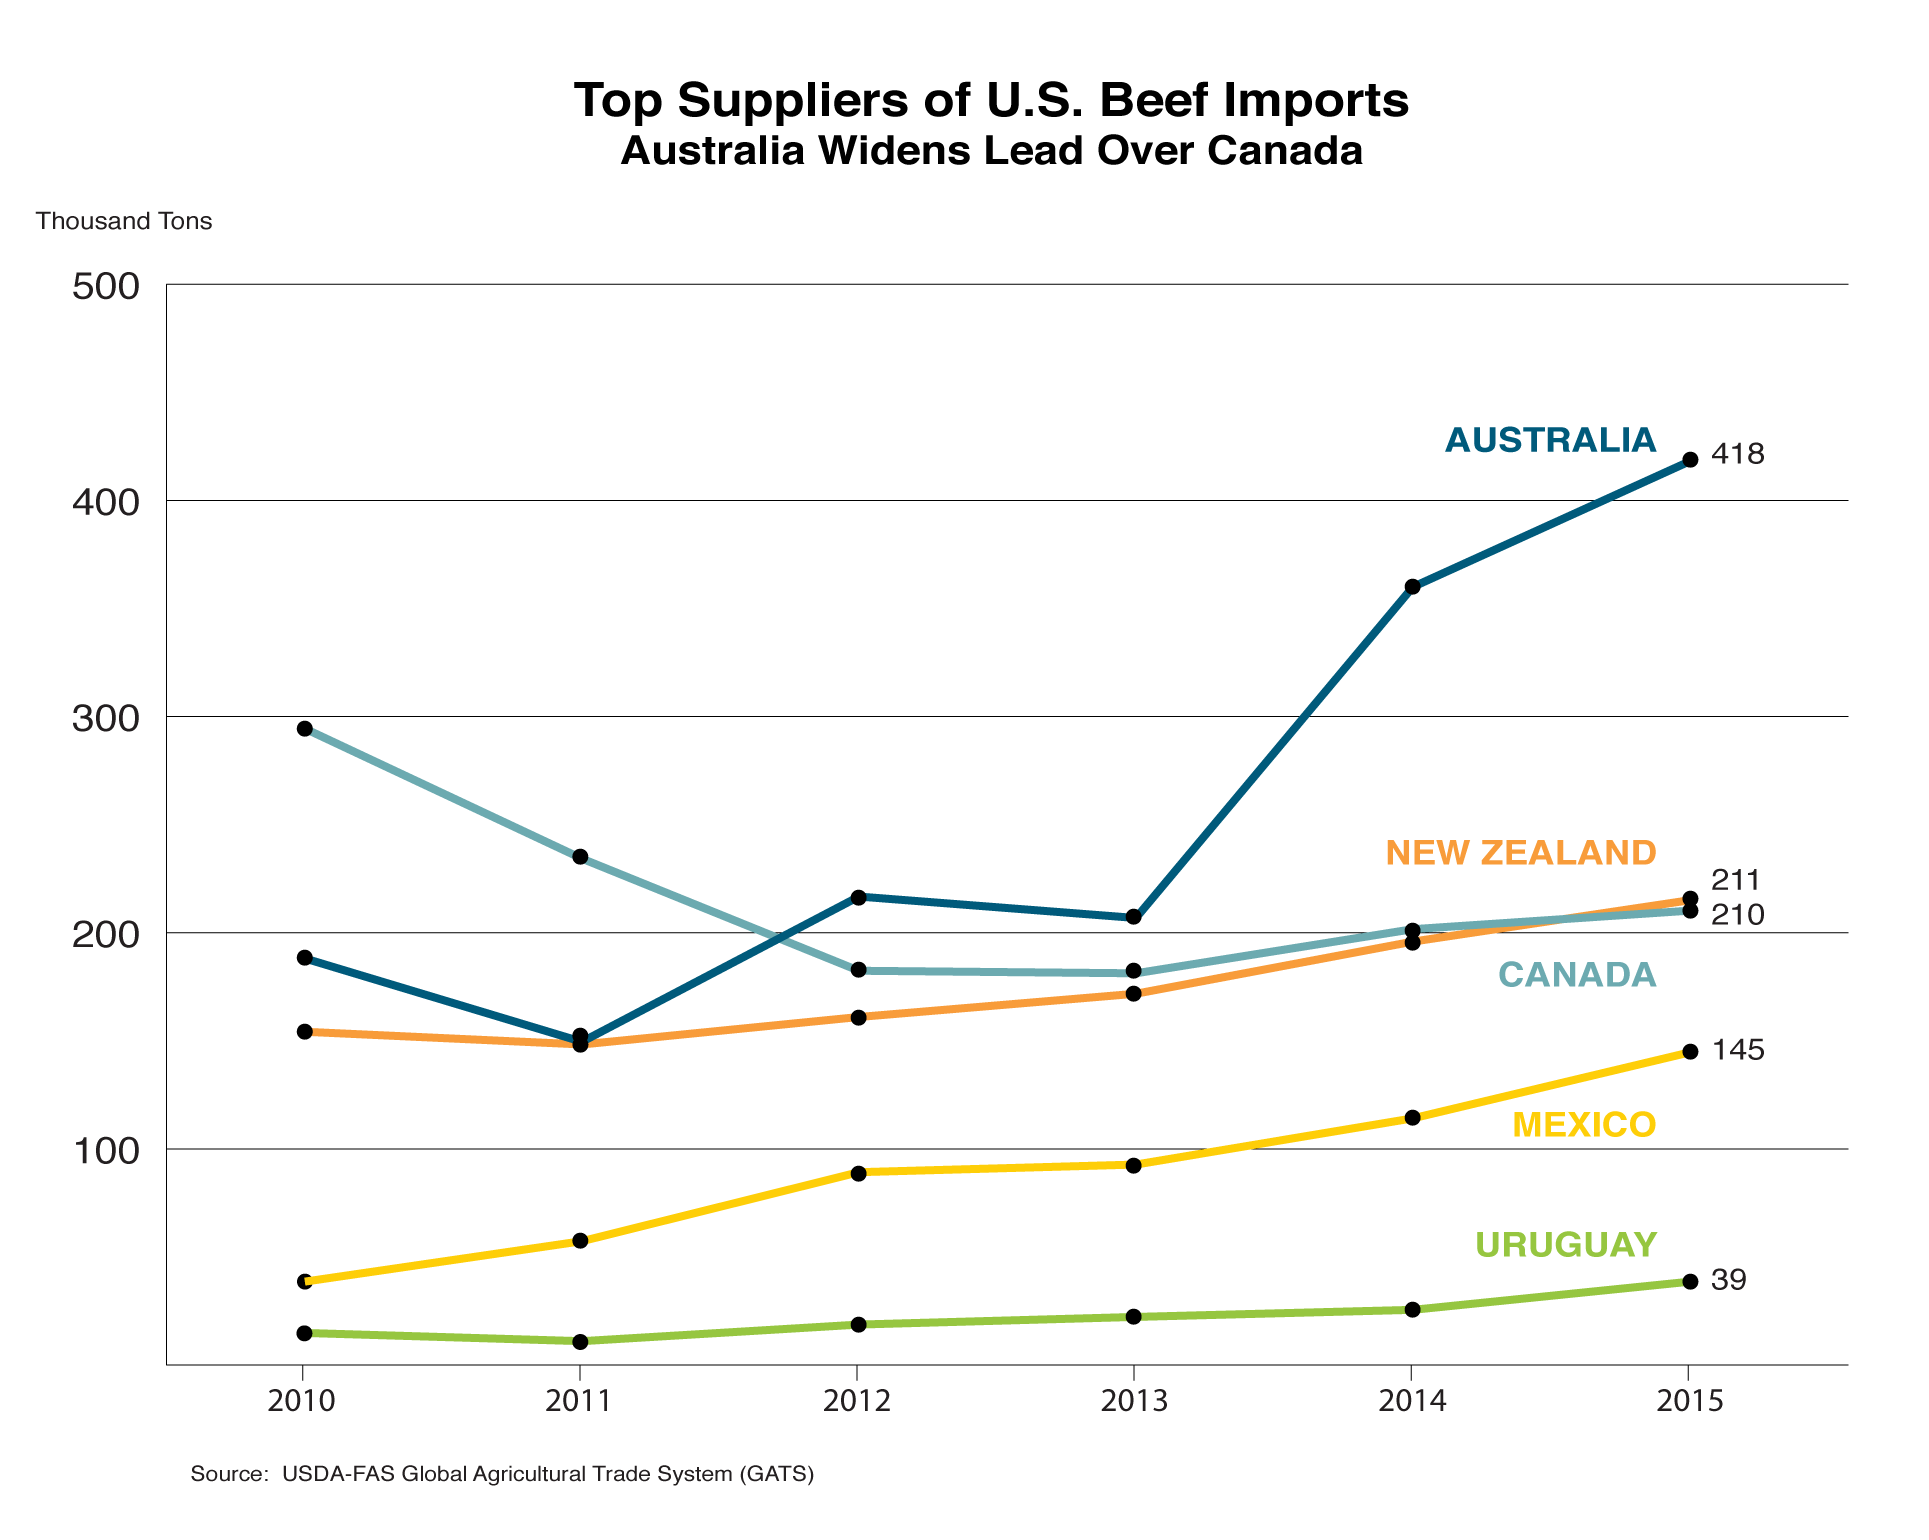
Australia was the leading supplier of U.S. beef imports in 2014 and 2015, while Canada and New Zealand were a distant second and third. Shipments from Australia and New Zealand are composed primarily of frozen boneless beef for processing, while shipments from Canada and Mexico are typically higher-value, fresh or chilled beef sold as cuts.

Sanitary Requirements for U.S. Beef Imports
For importers of beef to the United States, obtaining market access is a multi-step process. Countries must first be approved by the U.S. Department of Agriculture (USDA) Animal and Plant Health Inspection Service (APHIS) based on animal disease status. APHIS assesses the risks of introducing animal diseases as a result of trade. In addition, the USDA Food Safety and Inspection Service (FSIS) must certify that the importing country’s food regulatory system employs sanitary measures equivalent to U.S. standards. Currently, 12 countries are eligible to ship fresh or frozen beef to the United States: Australia, Canada, Chile, Costa Rica, Honduras, Ireland, Japan, Lithuania, Mexico, New Zealand, Nicaragua, and Uruguay.
U.S. World Trade Organization Tariff Rate Quotas
As a result of the 1995 World Trade Organization (WTO) Uruguay Round Agreement, the United States adopted a system of tariff rate quotas (TRQs) for imports of beef. The two-tiered system allows a specified volume of imports per calendar year at a lower rate of duty and assigns a higher tariff rate to volumes above the quota. Two types of U.S. TRQs were established through WTO negotiations:
- Country-Specific TRQs: Created for Australia, Japan, New Zealand, Uruguay, and Argentina (see table).
- Other Countries TRQ: Provides preferential-duty access for other countries that are eligible to ship beef to the United States.
| U.S. Tariff Rate Quotas and Imports of Beef in 2015 | ||||||
| Country | U.S. Imports1 | Tariff-rate Quota | Quota Fill-Rate | Rate of Duty | ||
| Tons | Million US | Tons | In-Quota | Above-Quota | ||
| Canada | 199,190 | $1,102 | Unlimited | N/A | 0% | N/A |
| Mexico | 136,104 | $1,002 | Unlimited | N/A | 0% | N/A |
| TRQ countries | | | | | | |
| Argentina | 0 | $0 | 20,000 | 0% | 4.4 cents/kg | 26.4% |
| Australia 2 | 412,203 | $2,469 | 418,214 | 99% | 0% | 21.1% |
| Japan | 183 | $15 | 200 | 92% | 4.4 cents/kg | 26.4% |
| New Zealand | 209,768 | $1,163 | 213,402 | 98% | 4.4 cents/kg | 26.4% |
| Uruguay | 19,760 | $238 | 20,000 | 99% | 4.4 cents/kg | 26.4% |
| Other 3 | 44,362 | $240 | 64,805 | 68% | 4.4 cents/kg | 26.4% |
| Total TRQs | 686,276 | $6,227 | 736,621 | 93% | | |
| 1 Imports include fresh/chilled and frozen beef only. Prepared and processed products are not subject to TRQs. Volumes are published by Customs and Border Protection, value is published by U.S. Census Bureau. | ||||||
| 2 Australia’s total TRQ includes a WTO quota of 378,214 plus an FTA quota of 40,000 tons. Excludes 4,000 tons at reduced tariff. | ||||||
| 3 Open to other countries that do not have a country-specific quota. | ||||||
| Sources: U.S. Customs and Border Protection; FAS Global Agricultural Trade System; U.S. International Trade Commission Harmonized Tariff Schedule 2015. | ||||||
Free Trade Agreement TRQs
TRQs are also created via free trade agreements (FTAs), in which case they are typically established as a transitional step towards duty-free access. The following agreements expanded beef market access into the United States:
NAFTA: As of January 2008, the North American Free Trade Agreement (NAFTA) was fully implemented, resulting in duty-free and unlimited access for beef among the United States, Canada and Mexico. Canada and Mexico are among the top suppliers of U.S. beef imports, accounting for about a third of shipments in 2015.
Australia: Australia received additional quota access in its 2005 FTA with the United States adding to its WTO quota of 378,214 tons. The agreement allowed supplemental duty-free access of 15,000 tons in the second year after enactment with a further 5,000 tons added annually or biannually. An additional quota with a reduced duty rate of 21 percent allows 3,500 tons in the first year, rising to 7,000 tons in 2022. In 2015 and 2016, total duty-free quota access is 418,214 tons, with a further 4,000 tons at reduced-duty. Unlimited duty-free access begins in 2023.
CAFTA-DR: The 2004 Dominican Republic-Central America FTA (CAFTA-DR) established preferential quotas for each of the six parties: Costa Rica, the Dominican Republic, El Salvador, Guatemala, Honduras, and Nicaragua (see table). TRQs are contingent on filling of the WTO “Other Countries” quota – currently available to Costa Rica, Honduras, and Nicaragua – which has yet to happen. Currently, those three countries are eligible to ship beef to the United States, and shipments totaled $229 million in 2015. Since the agreement was signed, U.S. beef imports from CAFTA-DR countries have risen, totaling more than 45,000 tons in 2015. In 2020, CAFTA-DR countries will have duty-free unlimited access to the U.S. market.
| CAFTA-DR Tariff Rate Quotas | |||
| Partners | 2015 U.S. Beef Imports | FTA TRQs (2016) | |
| | Million US | Tons | Tons |
| Costa Rica | $46 | 9,234 | 15,556 |
| Dominican Republic | $0 | 0 | 2,520 |
| El Salvador | $0 | 0 | 155 |
| Guatemala | $0 | 0 | 0 |
| Honduras | $6 | 1,140 | 775 |
| Nicaragua | $177 | 34,883 | 15,500 |
| Total | $229 | 45,256 | 34,506 |
| Sources: FAS Global Agricultural Trade System; U.S. International Trade Commission Harmonized Tariff Schedule, 2015 | |||
Other FTAs: Access has also been extended to the following countries through their respective FTAs with the United States: Bahrain, Chile, Colombia, Jordan, Morocco, Oman, Panama, and Singapore. TRQs are granted during the initial period of implementation and become unlimited at full implementation. At this time, only Chile is currently eligible to ship beef to the United States.
| Beef Access from Free Trade Agreements | |||
| Partner | 2016 FTA TRQs (Tons) | First Year of Implementation | Full Implementation (Unlimited Access) |
| Bahrain | Unlimited | 2006 | 2015 |
| Chile | Unlimited | 2004 | 2007 |
| Colombia | 6,381 | 2012 | 2021 |
| Morocco | 22,204 | 2006 | 2020 |
| Oman | 29,231 | 2009 | 2018 |
| Panama | 483 | 2012 | 2026 |
| Singapore | Unlimited | 2004 | 2013 |
| Sources: FAS Global Agricultural Trade System; U.S. International Trade Commission Harmonized Tariff Schedule 2015 | |||
WTO “Other Countries” TRQ
Eligible countries without a country-specific quota can access the “Other Countries” TRQ of 64,805 tons. Currently, five countries (Costa Rica, Honduras, Ireland, Lithuania, and Nicaragua) can use the quota, which provides a preferential duty rate of 4.4 cents per kilogram. Imports above 64,508 tons are charged the full tariff of 26.4 percent ad valorem.
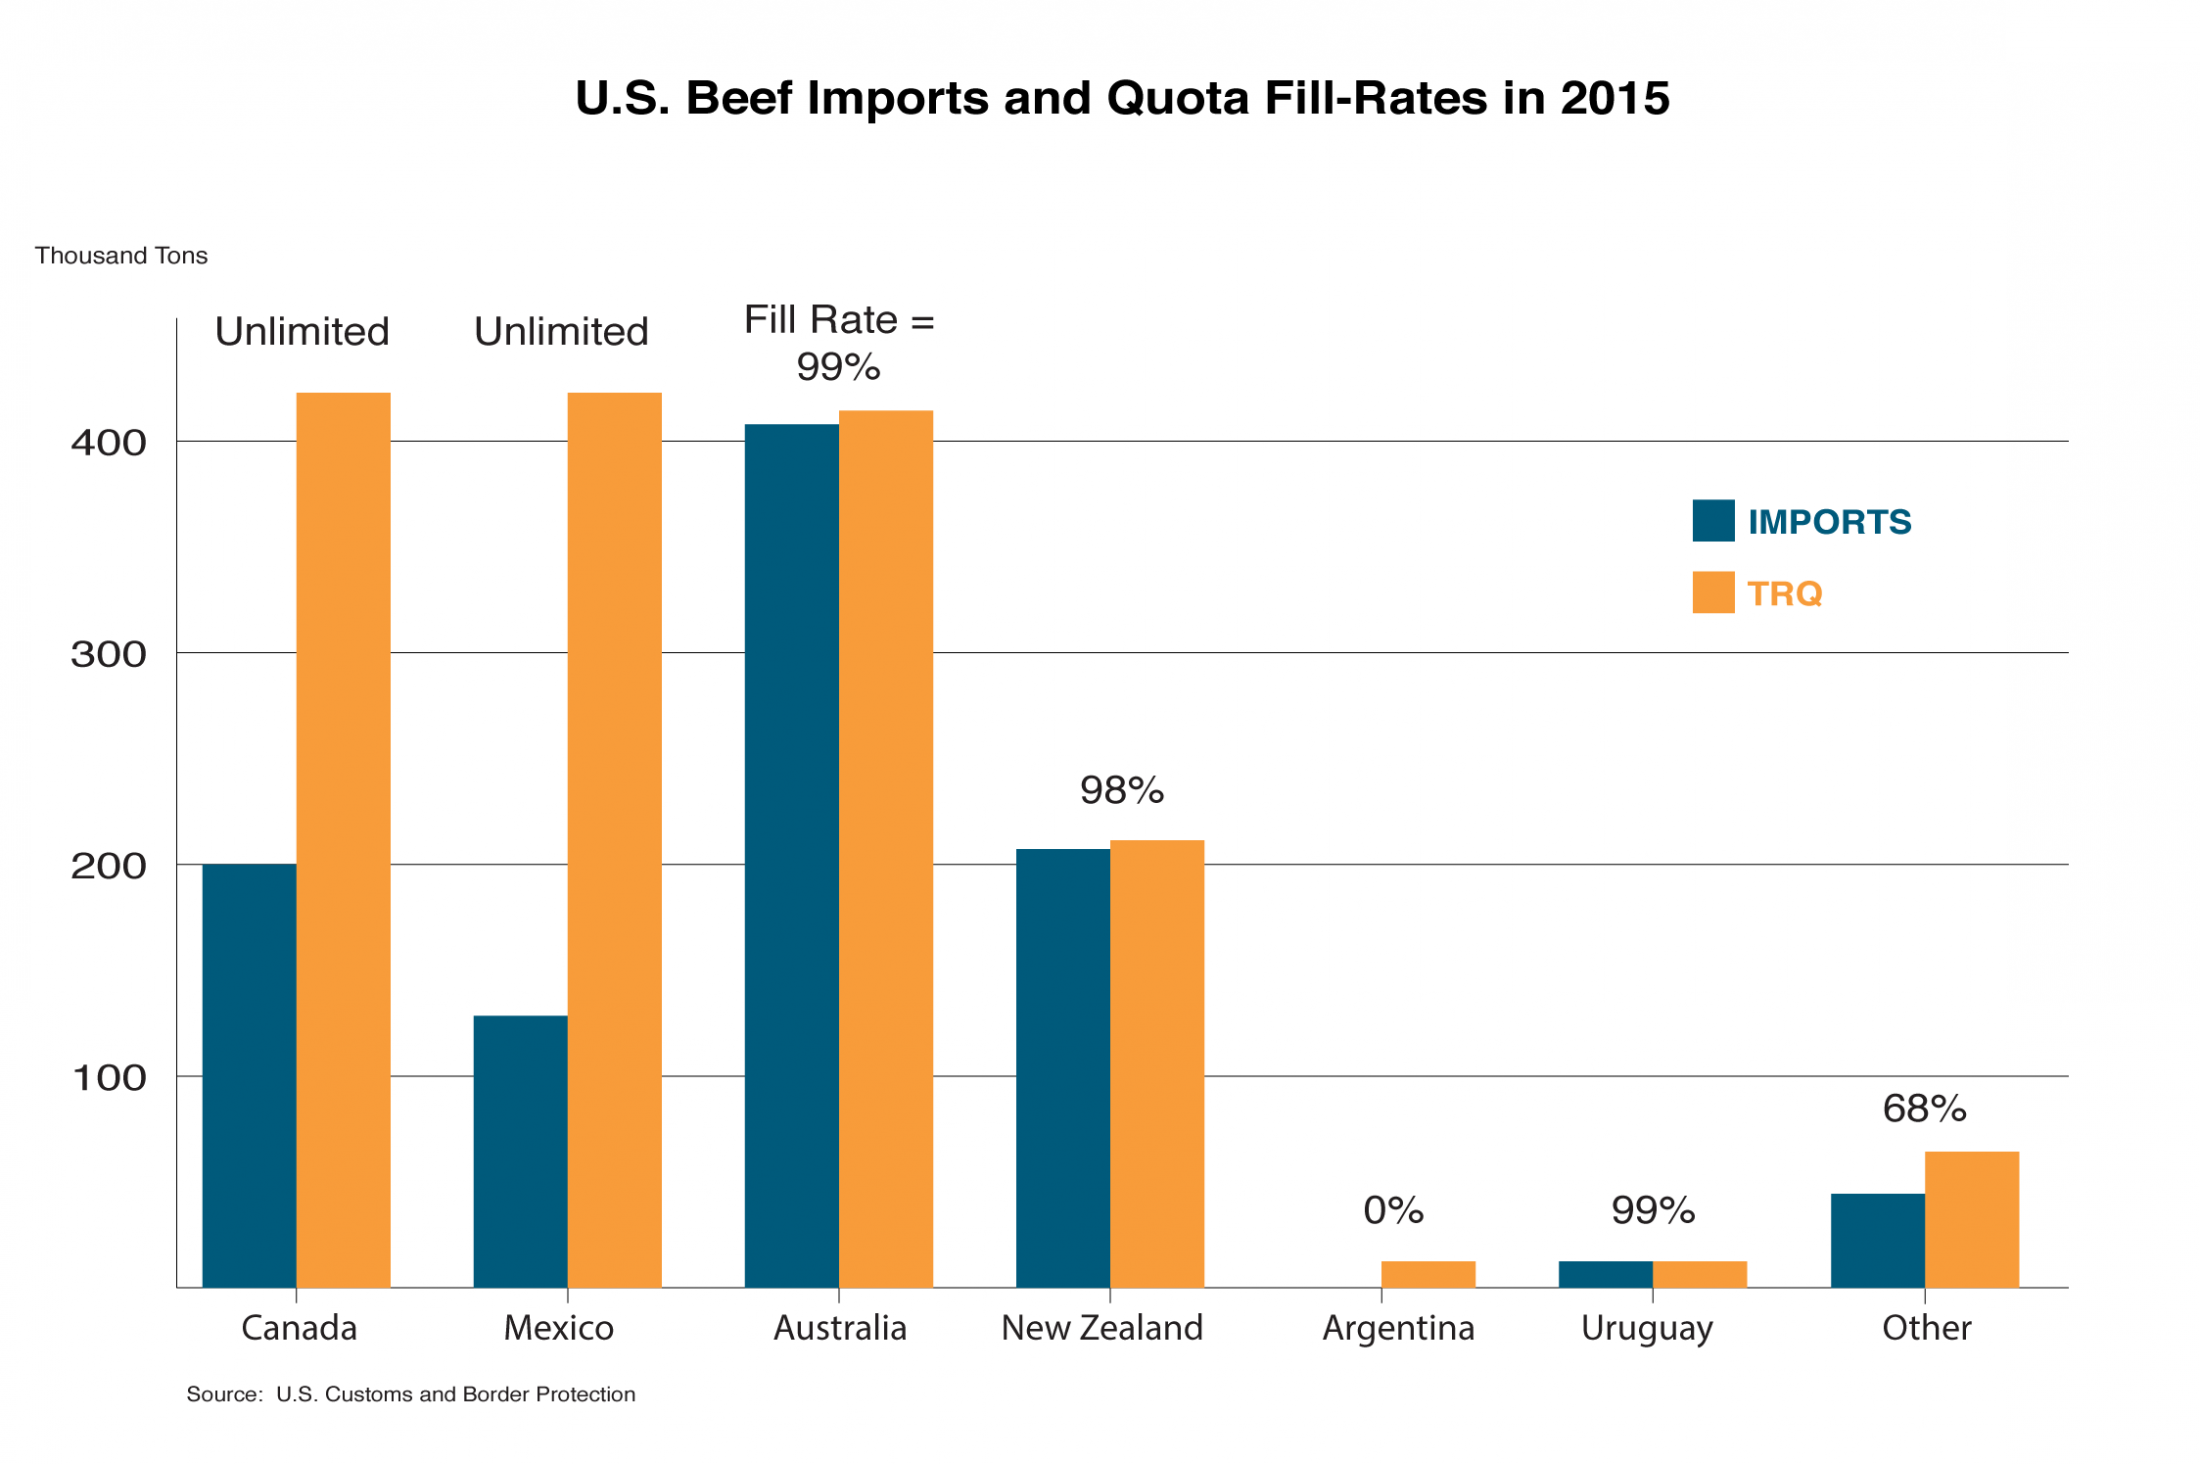
In 2015, the Other Countries TRQ reached a fill-rate of only 68 percent for the six eligible countries (see figure), despite strong U.S. import demand. The fill-rate has climbed over the past 10 years from a low of 45 percent in 2005 to a high of 94 percent in 2011. Once the WTO quota fills, country-specific TRQs from enacted FTAs will take effect, allowing an additional 34,506 tons for CAFTA-DR countries. As agreements are fully implemented, FTA partners will receive unlimited access, reducing pressure on the Other Countries TRQ.
Quota Allocation
The United States does not intervene in quota allocation; rather this is at the discretion of the exporting countries. For example, some countries distribute licenses to exporters. Australia maintains a system by which the quota is filled on a first-come, first-served basis until reaching a fill-rate of 85 percent. The remaining 15 percent is allocated based on historical quota use . The Other Countries TRQ is offered on a first-come, first-served basis to the eligible countries.

Future U.S. Market Access
If additional countries receive APHIS and FSIS approval to ship fresh/frozen beef, competition for the Other Countries TRQ is likely to accelerate, at least in the short-term. Under the current scenario, when a new country becomes eligible, imports could either displace shipments from other countries or be imported at the above-quota tariff rate. After 2020, competition by existing countries for this TRQ will lessen as CAFTA-DR is fully implemented. Nicaragua, which accounted for nearly 80 percent of quota use in 2015, will have unlimited access, creating opportunities for other shippers. Further quota expansion could be obtained through future WTO negotiations or future FTAs.
i Beef imports include fresh, chilled and frozen muscle cuts under HS headings 0201 and 0202 and exclude processed and prepared products which are not subject to U.S. tariff rate quotas.
ii For more information on requirements, see http://www.fsis.usda.gov/wps/portal/fsis/topics/international-affairs/importing-products.
iii For more information on Australia’s quota allocation system, please see: http://www.agriculture.gov.au/SiteCollectionDocuments/ag-food/quota/red-meat/2014/us-beef-2014-order.pdf
