South-South Agricultural Trade on the Rise
Contact:
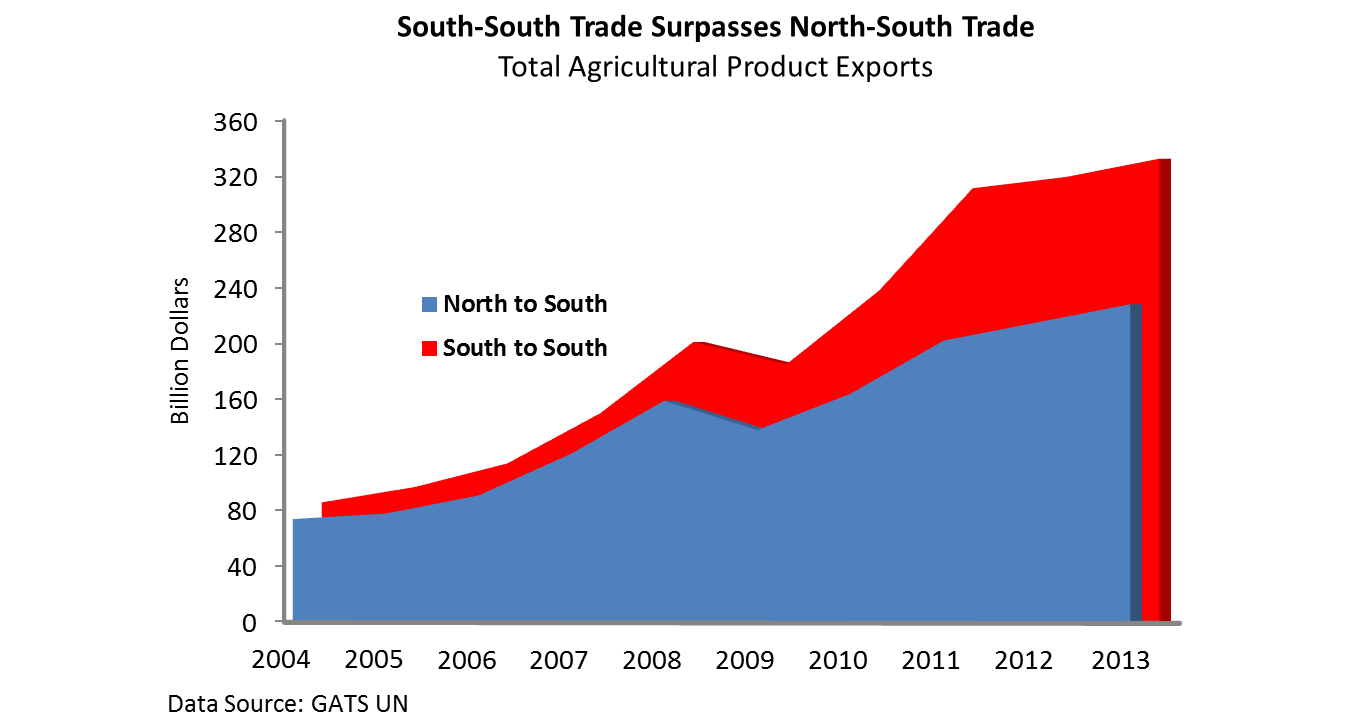
Global agricultural trade patterns have changed dramatically over the past several decades, particularly with the emergence of developing country exporters such as Brazil and Argentina. However, in just the past decade, one of the most apparent trends has been the growth in agricultural trade between developing countries (as defined by the World Trade Organization) or so-called “South-South trade.”
While exports from developing countries to developed markets (i.e., “North-South trade”) have also been impressive, it is clear that developing country exporters will continue to look to other developing country markets for growth. Since 2009, South-South trade has grown 80 percent, compared to 66 percent for North-South trade. However, both high tariffs and prevalent non-tariff barriers in developing countries remain a constraint to even greater export growth rates for developing country exporters.

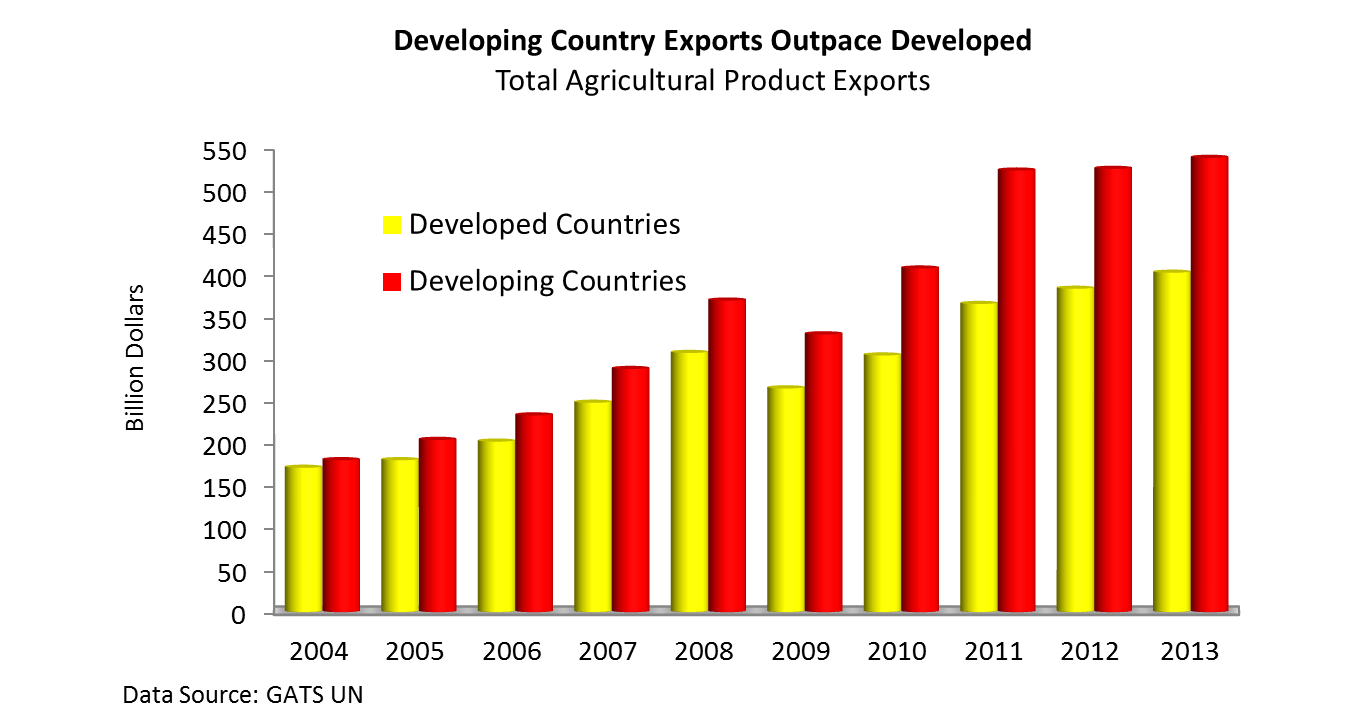
Developing Country Exports Show Remarkable Growth
Much of the growth in global exports in the past decade has been a result of sharp rises in agricultural exports from developing countries. In fact, since 2004, total agricultural exports from developing countries have risen 199 percent, compared to a 135-percent rise in developed country exports. Since 2009, exports from developing countries have grown 64 percent, compared to 52 percent from developed countries.

Exports from key developing countries have grown at much faster rates than those from major developed countries such as the European Union, Canada, Australia, and the United States. Of the 15 largest agricultural exporters over the past decade, the nine with highest growth rates are all developing countries: India, Ukraine, Indonesia, Brazil, Malaysia, Turkey, Thailand, Argentina, and China. Brazil is by far the largest developing country exporter, with $85 billion in agricultural exports in 2013 – nearly double the second-largest, China, which had $46 billion.
Among developing countries, China ranks as the second-largest agriculture exporter. This may come as a surprise given China’s massive imports, but early data for 2014 show another record year for nearly $49 billion in shipments. China exports a diverse range of high-value products, with fruits and vegetables leading the product mix. The United States and Japan are among the major markets for Chinese agricultural products but there has been rapid growth in recent years to Southeast Asia. India is the third-largest developing country exporter and has seen faster growth than any other major exporter. India also enjoys one of the largest agricultural trade surpluses among developing countries.
| Largest Developing Country Exporters | |||
| Product | 2013 Export Value (Billion USD) | Change from 2009 | Share to Developing Markets |
| Brazil | $84.6 | +59% | 66% |
| China | $46.1 | +65% | 56% |
| India | $41.8 | +188% | 79% |
| Argentina | $40.6 | +50% | 74% |
| Indonesia | $34.7 | +67% | 68% |
| Thailand | $32.7 | +53% | 67% |
| Malaysia | $26.5 | +47% | 76% |
| Mexico | $22.0 | +52% | 12% |
| Ukraine | $16.6 | +83% | 59% |
| Turkey | $16.1 | +58% | 56% |
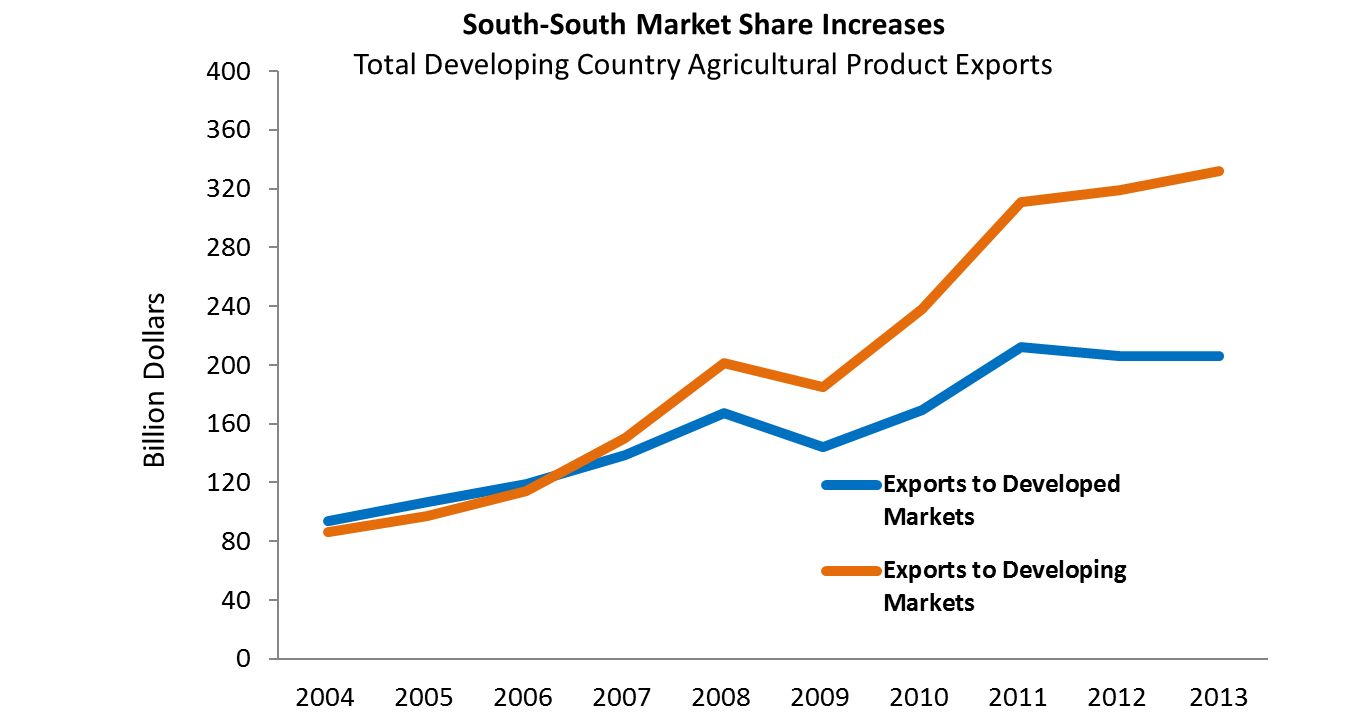
Growing Share of Developing Country Exports Go to Other Developing Markets
In 2013, 59 percent of developing country imports came from other developing countries, and developing countries are continuing to get a larger share in these markets. Of the 10 largest developing country exporters (see chart above), all except Mexico (which ships mostly to the United States) export the majority of their products to other developing countries. A decade ago less than half (48 percent) of developing country agricultural exports went to other developing countries but, by 2013, 62 percent did. India had the largest share of exports – 79 percent – going to other developing countries percent. This is in part due to soaring rice exports. India was the largest global rice exporter in 2012 and 2013, with shipments increasingly focused in Sub-Saharan African markets. Chinese exports to developing countries are growing thanks to strong demand from nearby markets. Brazil ships more than three quarters of its agricultural exports, primarily feeds and livestock products, to developing countries. Brazil appears to have much to gain from both the increasing demand for these products in developing countries and also lower barriers to trade in these markets.

Developing Country Exports to Developed Countries Also Strong
Not only has South-South trade increased significantly, but South-North trade has grown as well. For example, developing country exports to the United States have grown from $25 billion in 2004 to over $55 billion in 2013. Furthermore, the developing country share in the U.S. market increased over the same period from 45 percent to 54 percent in 2013. Many major developing country suppliers now enjoy a significant agricultural trade surplus with the United States, including Brazil, India, Argentina, Indonesia, Thailand and Malaysia. India, for example, exports more than three times as much of agricultural products as it imports from the United States. EU imports from developing countries also increased significantly in value terms and as a percentage of overall imports with developing countries accounting for 78 percent of all agricultural imports by the EU in 2013. Developing country exports to developed countries increased 120 percent in the past decade, with market share over the same period increasing from 49 percent to 54 percent.
Note: This report uses United Nations data from the FAS Global Agricultural Trade System (GATS), except in limited cases where trade data is not available for specific countries. In some of those cases, customs data from other official sources were used. At the time this report was published, the most recent UN data available for nearly all countries were from 2013. Trade covered in this report represents more than 98 percent of global trade. Only external-EU trade is counted. For more information on specific developing country exporters please see the following FAS reports:
