A Turning Point for Agricultural Exports to Sub-Saharan Africa
Contact:
Sub-Saharan Africa’s voracious appetite for imported agricultural goods is a direct result of the region’s robust growth in gross domestic product (GDP) and population. In 2014, Sub-Saharan Africa imported an estimated $48.5 billion1 in food and agricultural products, a value that has been growing rapidly for the last two decades. While U.S. exports to Sub-Saharan Africa have slowed recently (dropping from a record $3.0 billion in 2012, to $2.3 billion in 2014), several key U.S. exports continue to thrive, laying a roadmap for future success in the region.
Economic Growth Drives Demand for Agricultural Imports
In the last 10 years, Sub-Saharan Africa’s GDP has grown by 60 percent2 and its middle class has expanded by 90 percent3. This is the fastest growth of any region in the world other than South Asia. The region’s economic growth has created strong demand for agricultural goods.
In the last two decades, Sub-Saharan Africa’s agricultural imports have seen rapid growth – averaging more than 13 percent annually. In 2014, total imports reached an estimated $48.5 billion, the second-highest on record. In comparison, India imported only $17.6 billion in agricultural products, despite having 300 million more people than Sub-Saharan Africa. Sub-Saharan Africa’s total agricultural imports include $11.7 billion from other countries within the region and $36.8 billion from the rest of the world. In the last five years, growth in intra-regional trade has outpaced growth in imports from outside of Sub-Saharan Africa (100 percent vs. 60 percent).
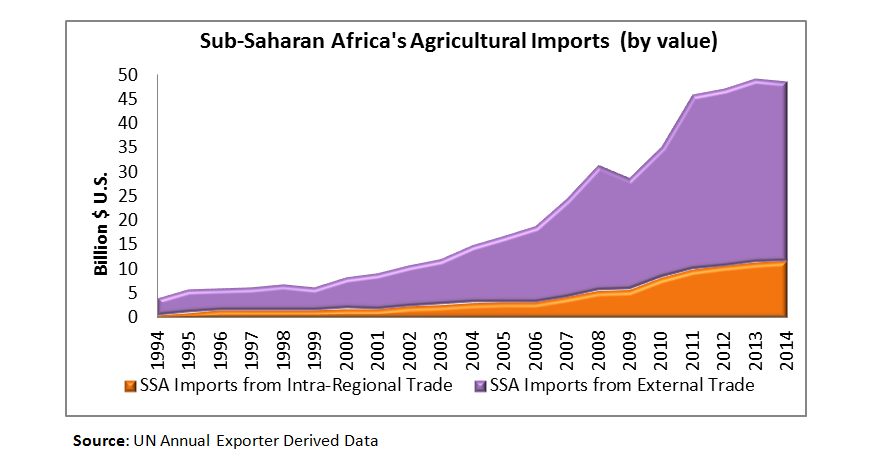
In 2011, Sub-Saharan Africa’s agricultural imports slowed abruptly. Instead of the 16 percent average year-on-year growth from 1994 to 2011, year-on-year import growth averaged only two percent. From 2013 to 2014, imports fell, as agricultural shipments decreased in both value and volume. While difficult to attribute to any specific factor, this slowdown affected countries across the region, with annual imports declining in four of the six largest Sub-Saharan Africa markets from 2011 to 2014.
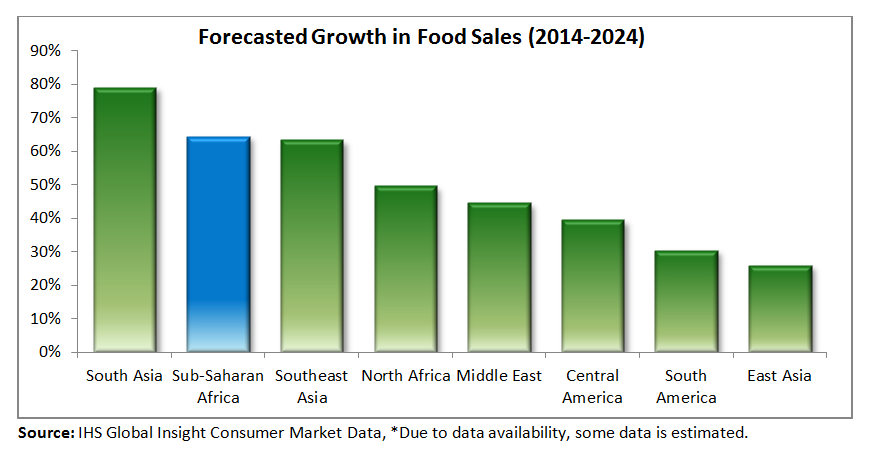
Nevertheless, most analysts believe the future remains bright for agricultural exports to Sub-Saharan Africa as the region’s middle class is expected to grow 90 percent by 2024, fueling a 60-percent increase in food sales. This is the most positive forecast for any region of the world market, with the exception of South Asia.

Consumer-Oriented Imports Growing Fastest
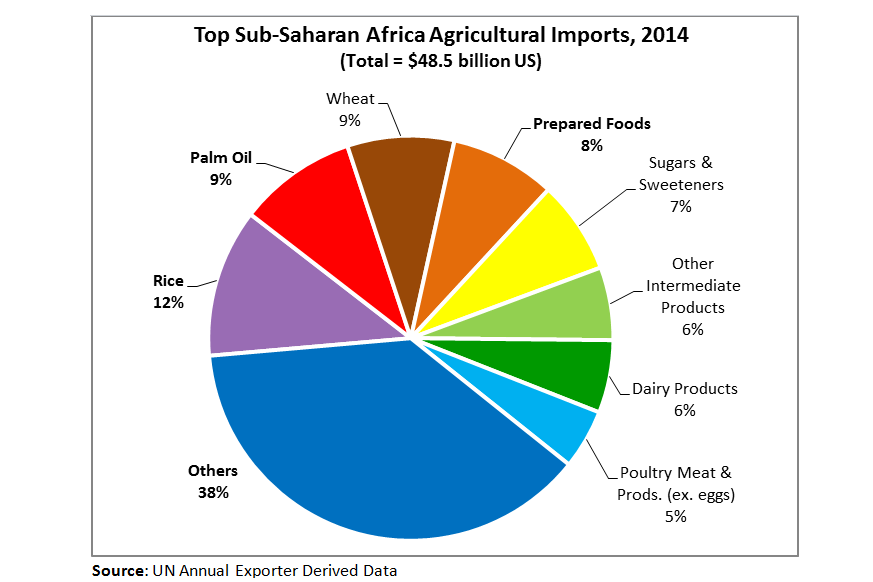
Sub-Saharan Africa’s top agricultural imports are consumer-oriented products, namely prepared foods, dairy, poultry, wine/beer, and vegetables. Imports of consumer-oriented goods have grown 70 percent in the last five years and now make up more than 40 percent of the region’s total imports. Imports of intermediate products, primarily palm oil and sugar, have grown rapidly. Growth in bulk commodity imports has been slower, but there is still strong demand for rice and wheat, which accounted for one-fifth of all agricultural imports in the region.
Bright Future for U.S. Consumer-Oriented Product Exports
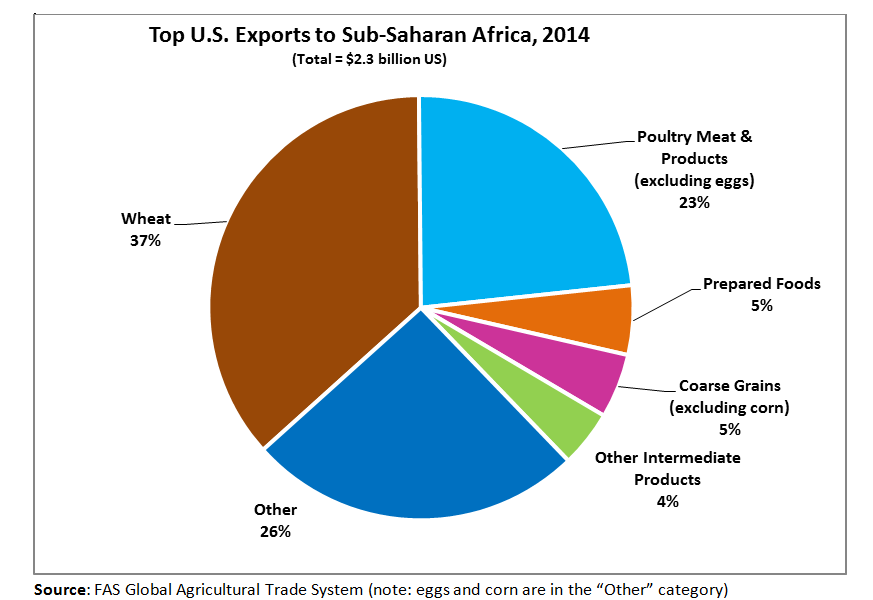
The United States has a broad presence in Sub-Saharan Africa, having made inroads in many top markets in the region. Fueled by soaring demand in the region, U.S. agricultural exports reached $2.3 billion in 2014 – a 20-percent increase over five years.
| U.S. and Global Agricultural Exports to Sub-Sahara Africa, 2014 | |||
| Country | Imports from U.S. (million USD) | Total Imports (million USD) | U.S. Market Share |
| Nigeria | $847 | $5,864 | 14% |
| Angola | $298 | $4,092 | 7% |
| South Africa | $259 | $5,921 | 4% |
| Ghana | $129 | $1,668 | 8% |
| Ethiopia | $83 | $380 | 22% |
| Kenya | $69 | $1,698 | 4% |
| Total Imports | $2,303 | $48,541 | 5% |
| Source: UN Annual Exporter Derived Data | |||
Overall, consumer-oriented products have seen the highest growth. The brightest star has been U.S. poultry exports, led by strong demand in Angola. In 2014, Sub-Saharan Africa was the third-largest market for U.S. poultry and has experienced 30-percent year-on-year growth for the last five years. In addition, U.S. exports of prepared foods, condiments/sauces, and dairy products have all seen strong growth in the last five years. Even as Sub-Saharan Africa’s overall imports have slowed, demand for consumer-oriented products from the United States has continued to grow.
Another success story has been U.S. wheat exports. Sub-Saharan Africa has long been the top destination for U.S. wheat exports and will likely continue to be a significant market. While Nigeria has traditionally accounted for the majority of U.S. wheat exports to the region, other countries in West and East Africa have seen strong growth. Coarse grains and other intermediate products were also notable U.S. exports in 2014.
Increased Competition from Intra-Regional Trade
While some U.S. exports have experienced success in Sub-Saharan Africa, the overall U.S. market share has been shrinking, down from 15 percent to just 5 percent over the last two decades. When the growth in Sub-Saharan Africa’s agricultural imports began to slow in 2011, U.S. exports to the region dropped by 23 percent. During this same time period, imports from the EU and Thailand grew by 13 percent and 11 percent, respectively. While a portion of the U.S. decline in can be attributed to economic factors such as exchange rates and falling commodity prices, increased competition from intra-regional trade presents the biggest challenge for U.S. exporters.
Continental Africa has seen a renewed movement towards stronger intra-regional trade. For example, the major regional trading blocs – the Common Market for Eastern and Southern Africa (COMESA), the East African Community (EAC), and the Southern Africa Development Community (SADC) – launched a Tripartite Free Trade Area in 2015. Recent trade data already reflect increased intra-regional trade. As agricultural shipments from outside Sub-Saharan Africa remained virtually unchanged from 2011 to 2014, intra-regional trade continued to grow. In particular, South Africa and Zimbabwe have been successful in marketing prepared foods, dairy products, wine and beer, fruits and vegetables, and poultry to other Sub-Saharan Africa countries. These exports compete directly with U.S. exports.
In addition to intra-regional competition, the developing economies of Thailand, India, Malaysia, and Indonesia have also become major exporters to Sub-Saharan Africa. Together, these four countries account for more than 30 percent of all external agricultural exports to Sub-Saharan Africa. However, this has posed less of a challenge to U.S. exports, since these countries primarily export non-competing goods such as rice, sugar, and palm oil. Nor do China’s agricultural exports to the region, primarily processed vegetables and tea, compete directly with the United States’ primary exports, which are wheat, poultry, and processed products. In fact, China’s presence in Sub-Saharan Africa is actually a net importer from Sub-Saharan Africa, rather than a U.S. competitor.
Lastly, the EU and Brazil are also significant U.S. competitors in Sub-Saharan Africa. With shipments worth $11.7 billion in 2014, the EU accounted for roughly a quarter of the region’s agricultural imports, dominated by consumer-oriented goods including prepared foods ($1.9 billion), dairy products ($1.5 billion), wine and beer ($1.0 billion), and poultry ($800 million). The EU’s top bulk commodity export to the region was wheat ($1.3 billion). But like the United States, the EU has also seen its market share slip – from roughly 50 percent in 2004 to just over 25 percent in 2014. Brazil has also faced tough competition in Sub-Saharan Africa, as its sugar exports have had to compete with those from Southeast Asia and its poultry exports have slowed.
| Major Agricultural Exporters to Sub-Saharan Africa | |||
| | 2014 Export Value (billion US) | % of Region’s Total Ag Imports | Export Growth (2009-2014) |
| European Union | $11.7 | 26% | 64% |
| South Africa | $4.1 | 9% | 144% |
| Thailand | $3.1 | 7% | 22% |
| India | $2.9 | 6% | 500% |
| Brazil | $2.7 | 6% | 2% |
| Malaysia | $2.4 | 5% | 92% |
| Indonesia | $2.4 | 5% | 379% |
| United States | $2.3 | 5% | 19% |
| China | $1.6 | 4% | 65% |
| Total Exports | $44.8 | 74% | |
| Source: UN Annual Exporter Derived Data | |||
Country-Specific Engagement Key to New Opportunities
Sub-Saharan Africa is not a monolithic import market. Each country in the region presents a unique set of import demands and challenges. Six countries account for about half of all agricultural imports in the region. The following are examples of U.S. export opportunities in these top markets: South Africa, Nigeria, Angola, Benin, Ghana, and Kenya.
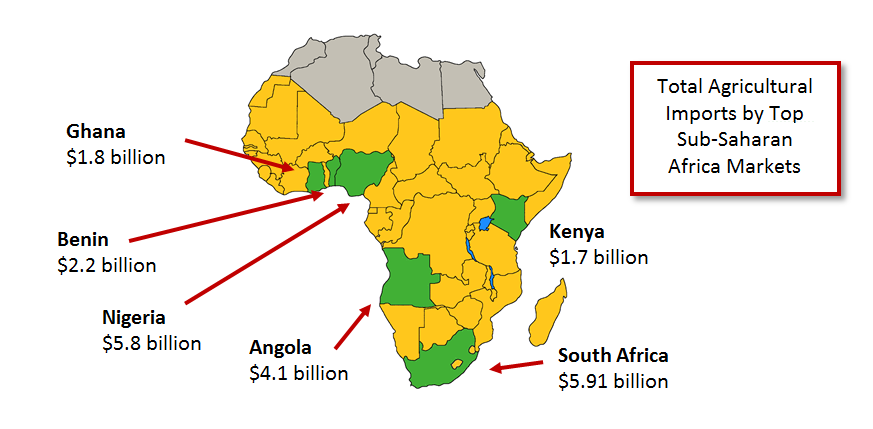
South Africa: In 2014, South Africa imported $5.9 billion of highly diversified agricultural products. While South Africa currently remains the region’s largest importer, its import growth has recently slowed, peaking in 2012 and decreasing by 25 percent in 2014 to nearly $6 billion. Self-sufficiency policies and slowing economic growth were both factors in the decline. South Africa’s top agricultural imports include wheat, rice, other intermediate products, essential oils, palm oil, and poultry. The United States is a residual supplier of wheat to South Africa and exports have fluctuated between $10 million and $100 million. The top competitor for U.S. agriculture in South Africa is the EU, with almost 30 percent of the market versus 4 percent for the United States. South Africa currently imposes a number of trade barriers, inconsistent with international standards, which restrict the imports of U.S. poultry, beef, and pork.
Nigeria: Nigeria’s agricultural imports have increased nearly twice as fast as South Africa’s over the last five years (52 percent vs. 27 percent), reaching $5.8 billion in 2014. Based on current trends, Nigeria will overtake South Africa as the largest importer in Sub-Saharan Africa, mainly due to its growing market for consumer-oriented goods. While Nigeria’s imports of bulk commodities (mainly wheat and rice) fluctuate greatly, the steadily growing demand for consumer-oriented goods bodes well for U.S. exporters. Dairy, prepared foods, wine and beer, and condiments and sauces all have growth potential. The EU competes directly with the
United States in nearly all categories of exports to Nigeria.
Angola: Despite the Angolan government’s declarations that the country relies too heavily on foreign agricultural imports, 2014 was a record year for agricultural imports, totaling $4.1 billion. The United States is already the largest poultry exporter to Angola, with 55 percent of the market and a reputation for high-quality meat. The majority of current U.S. poultry exports are frozen cut chicken, leaving room for increased exports of frozen cut turkey, which could help offset decreasing demand in East Asia. In addition, there is potential for increased U.S. exports of beef variety meats, wine and beer, prepared foods, dairy products, and pork products. The United States’ largest competitor is the EU, which accounts for 40 percent of the Angolan import market.
Benin: Benin serves as a strategic trans-shipment point to the larger landlocked West African nations of Mali, Niger, Burkina Faso, and Chad, making it a unique importer. For example, exporters reported $2.2 billion in agricultural exports to Benin in 2014, but Benin itself only reported imports of $426 million, meaning about $1.7 billion in goods was trans-shipped to other countries.
Ghana: Ghana is a promising new market for U.S. exporters. In 2014, U.S. exports accounted for only seven percent of Ghana’s $1.8 billion in agricultural imports. Ghana’s main imports were rice from Thailand and Vietnam, palm oil from Southeast Asia, and sugar from Southeast Asia. The United States is already the largest poultry exporter to Ghana, having wrested market share away from the EU and Brazil. In 2014, U.S. poultry exports set a record at $68 million and accounted for 36 percent of Brazil’s total $188 million poultry market. Ghana’s steady economic growth has fueled new demand among the rising middle class for consumer-oriented products, including poultry, beef, dairy, and prepared foods.
Kenya: A large, diversified importer, Kenya is also one of the few net exporters of agricultural products in Sub-Saharan Africa, primarily due to large exports of tea. In 2014, Kenya imported $1.7 billion of agricultural products, including rice, wheat, palm oil, sugar, and several consumer-oriented products. Due to its location on Africa’s east coast, shipping costs from the
United States can comprise up to 70 percent of the import value, making it cost-prohibitive for many U.S. exporters. However, as decreasing oil prices lower shipping rates, that may change. Currently, the EU is the largest supplier to Kenya, followed by Pakistan and Uganda.
In summary, Sub-Saharan Africa is a diverse, challenging market, where soaring economic growth has fueled an equally strong demand for imported agricultural products. While some U.S. exports to Sub-Saharan Africa have decreased, a strong economic outlook, a growing middle class, and increased demand for consumer-oriented products all indicate that Sub-Saharan Africa will continue as one of the fastest growing export regions for U.S. agricultural products.
1Trade data from the UN Annual Exporter-Derived Data. Due to data availability, some 2014 data is estimated.
2Source: Global Insight, GDP measured in constant 2005 U.S. Purchasing Power Parity (PPP) dollars
3Source: Global Insight, middle class data measured in constant 2005 U.S. PPP dollars
