U.S. Exports of Corn-Based Products Continue to Climb
U.S. exports of corn-based products have experienced rapid growth in the past decade, reaching a value of $7.6 billion in fiscal year 2014, up 16 percent from the previous year. Exports of U.S. distiller’s dried grains (DDG) reached a new record, and ethanol exports were able to partially rebound from the previous year’s decline. Exports of corn-based products have grown in size and importance for the U.S. corn industry. In fact, in FY 2013, the value of these products surpassed the value of bulk corn exports (although bulk exports recovered in FY 2014).

Record U.S. DDG Exports Driven By China Sales
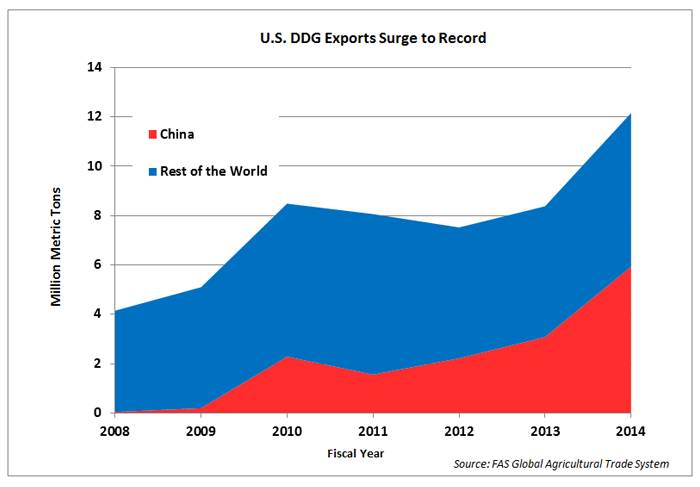
U.S. exports of DDG reached a record in both quantity and value in FY 2014, with value up 27 percent from the previous year to nearly $3.4 billion, and volume up 45 percent. U.S. DDG exports have tripled since 2008. This growth has occurred in spite of the fact that, for most of this period, the use of corn for ethanol production in the United States has been flat.
China has been the primary driver of the growth in DDG exports, accounting for half of all U.S. exports in FY 2014. Mexico is the United States’ second-largest market for DDG, but imports have been flat during the past four years at approximately $400 million. Despite the trend of years of rising DDG exports, the outlook for FY 2015 is uncertain and much will depend on Chinese import policies.

U.S. Ethanol Exports Recover in 2014
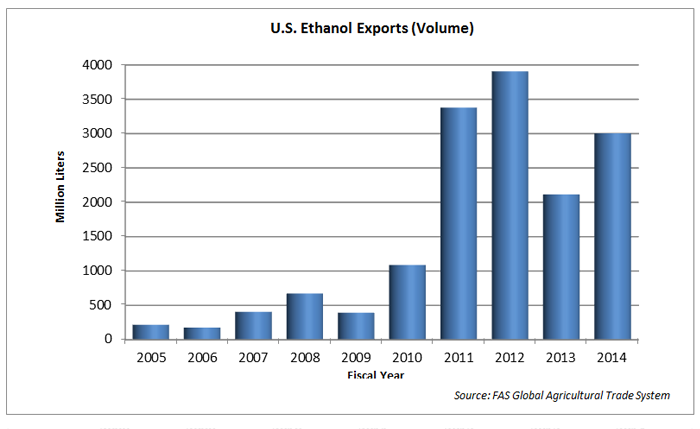
U.S. ethanol exports rebounded in FY 2014, up about 40 percent in value and volume from 2013, but still below the record level of 2012. Nearly six percent of ethanol produced in the United States was exported last year.


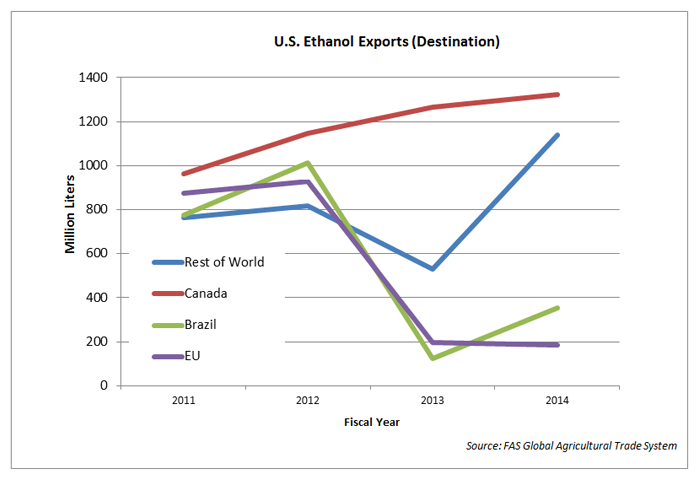
Canada is, by far, the largest market for U.S. ethanol exports, accounting for over 40 percent of total exports. Exports to Canada have increased every year for the past 5 years.
Exports to Brazil, the world’s second largest ethanol producer, doubled this past year, making Brazil the number two market for the United States. However, U.S. ethanol exports to Brazil were far below the levels of 2011 and 2012 when high sugar prices encouraged imports.
U.S. ethanol exports to the European Union remained flat in FY 2014 as exports continue to be constrained by anti-dumping duties that were put in place in 2013.
The strongest growth in U.S. ethanol exports last year was to the United Arab Emirates, the Philippines, and India – the third-, fourth-, and sixth-largest markets, respectively. For the Philippines, imports have increased as domestic production is unable to satisfy the 10-percent mandated blending level in gasoline. In the case of India, ethanol imports have benefited from relatively low tariff rates.
Other U.S. Corn Products Exports See Long-Term Growth
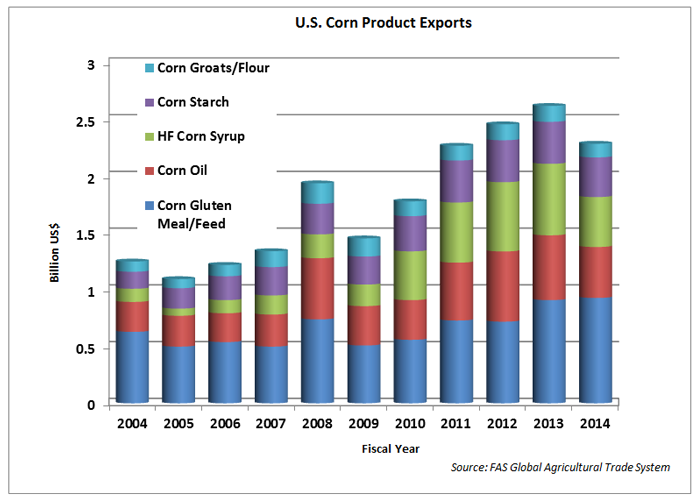
Although the exports of some key corn-based products declined in FY 2014, many have experienced a long-term growth trends. These key products include:
Corn Gluten Meal/Feed: U.S. exports of corn gluten meal reached a new record in FY 2014 year in both value and volume, rising to $704 million, up six percent from the previous year. Indonesia remains the largest market, but there was extremely strong growth (over 50 percent) to both Egypt and Chile, the second- and third-largest markets, respectively. Exports of corn gluten feed were down nine percent to $226 million, although volume was actually up slightly. The EU, primarily Ireland, remained the largest U.S. market.
High-Fructose Corn Syrup: U.S. exports of high-fructose corn syrup (HFCS) in FY 2014 were valued at $436 million, down 21 percent from FY 2013. More than three quarters of U.S. HFCS exports go to Mexico, and corn syrup import demand there fell as a result of lower sugar prices.
Corn Oil: U.S. corn oil exports were valued at $449 million in FY 2014, down 18 percent from the previous year. Approximately 55 percent of corn oil exports are crude oil, with the other 45 percent being refined oil. North African/Middle Eastern markets are by far the largest buyers, accounting for more than two-thirds of both U.S. crude and refined corn oil exports.

| Export Growth for Corn-Based Products | |||
| Product | FY 2009 Export Value (Million US) | FY 2014 Export Value (Million US) | Increase |
| Distiller’s Dried Grains | $920 | $3,377 | +267% |
| Ethanol | $230 | $1,981 | +884% |
| Corn Gluten Meal/Feed | $510 | $929 | +82% |
| Corn Oil | $310 | $449 | +45% |
| High Fructose Corn Syrup | $170 | $436 | +156% |
| Corn Starch | $274 | $346 | +26% |
| Corn Groats/Flour | $162 | $124 | -23% |
| Total | $2,576 | $7,642 | +197% |
Note: This report focuses on corn-based products and by-products. For information about value-added corn exports in the form of U.S. meat exports, please see the May 1, 2013 report, For U.S. Corn, Value-Added Exports Outpace Bulk Exports.
