U.S. Sorghum Prices Rally with China’s Return to the Market
Contact:
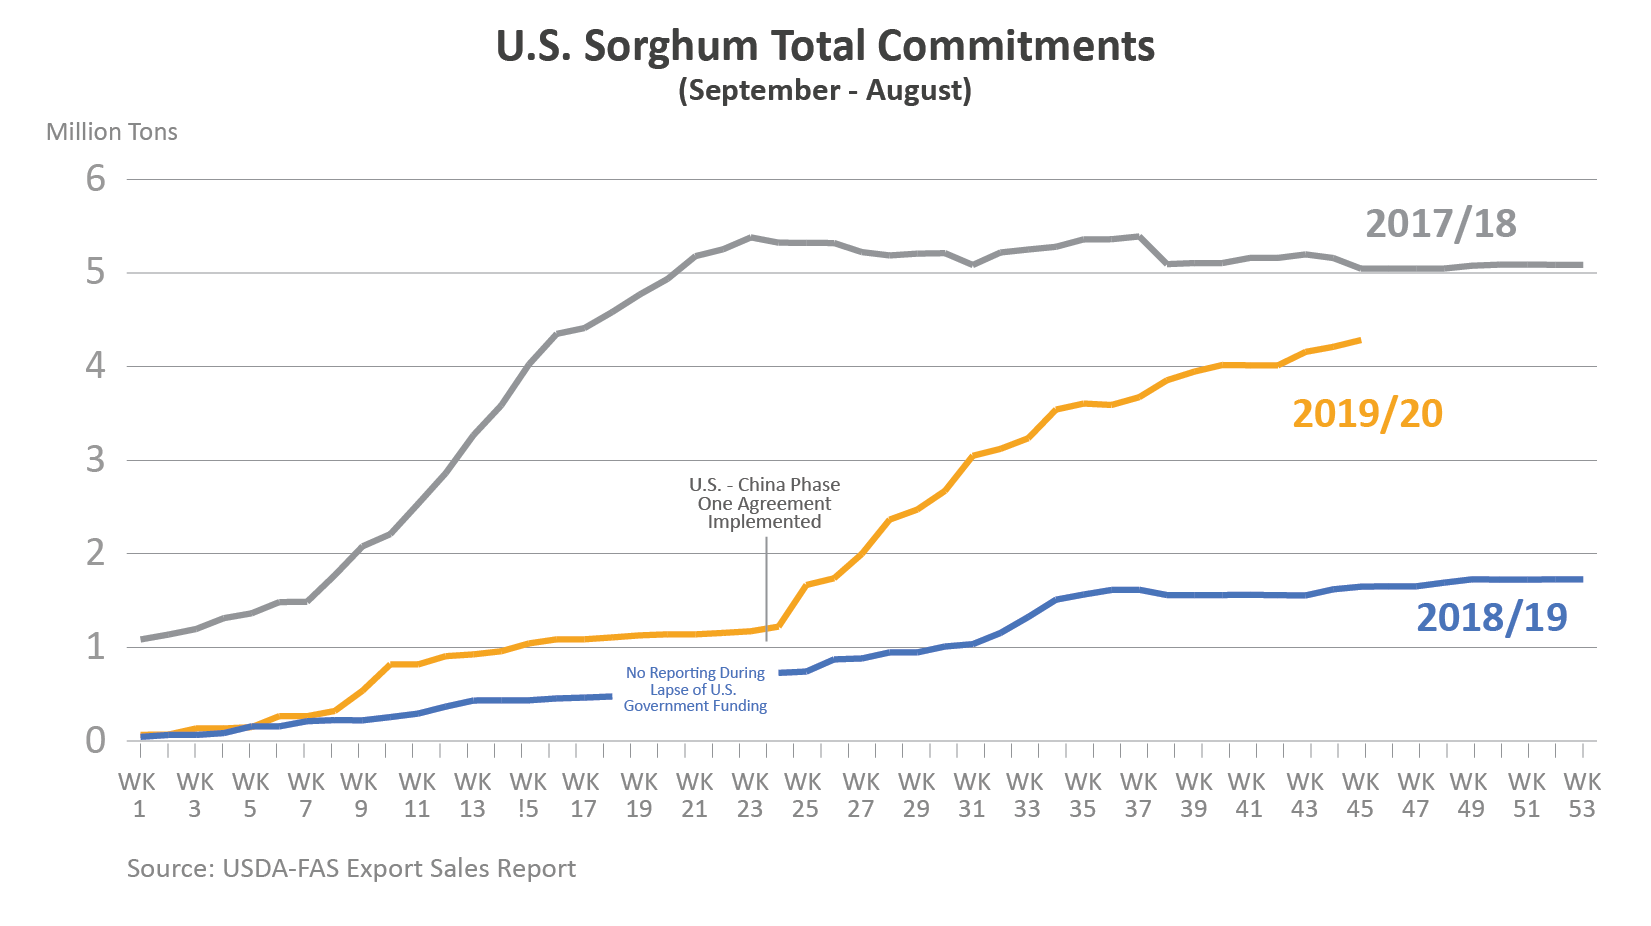
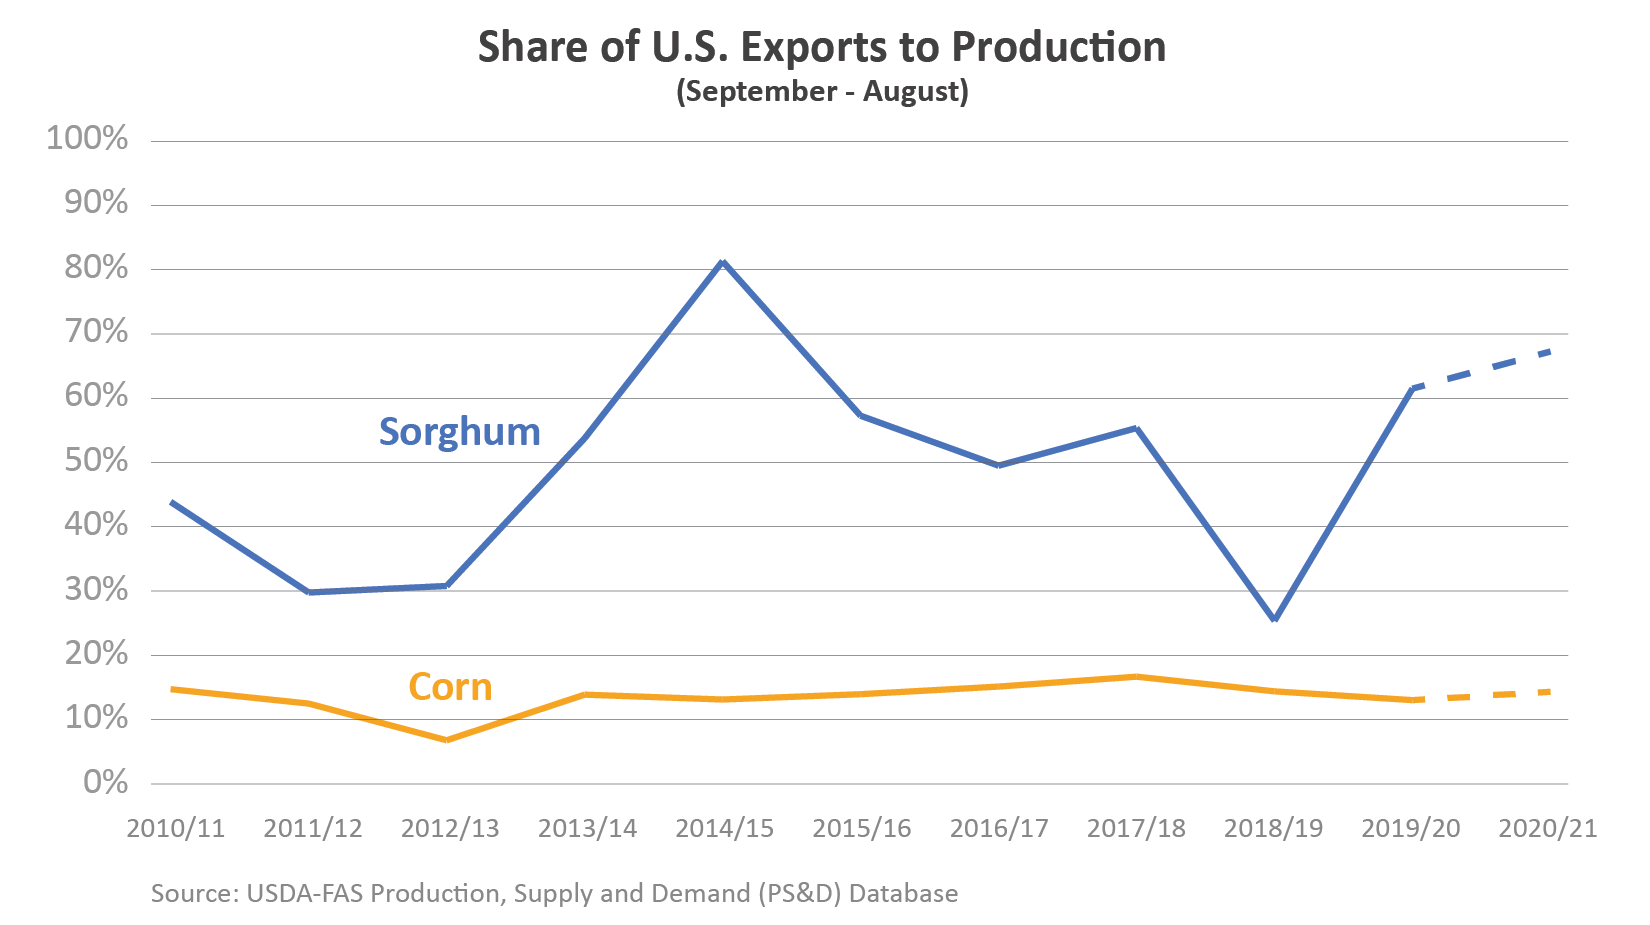
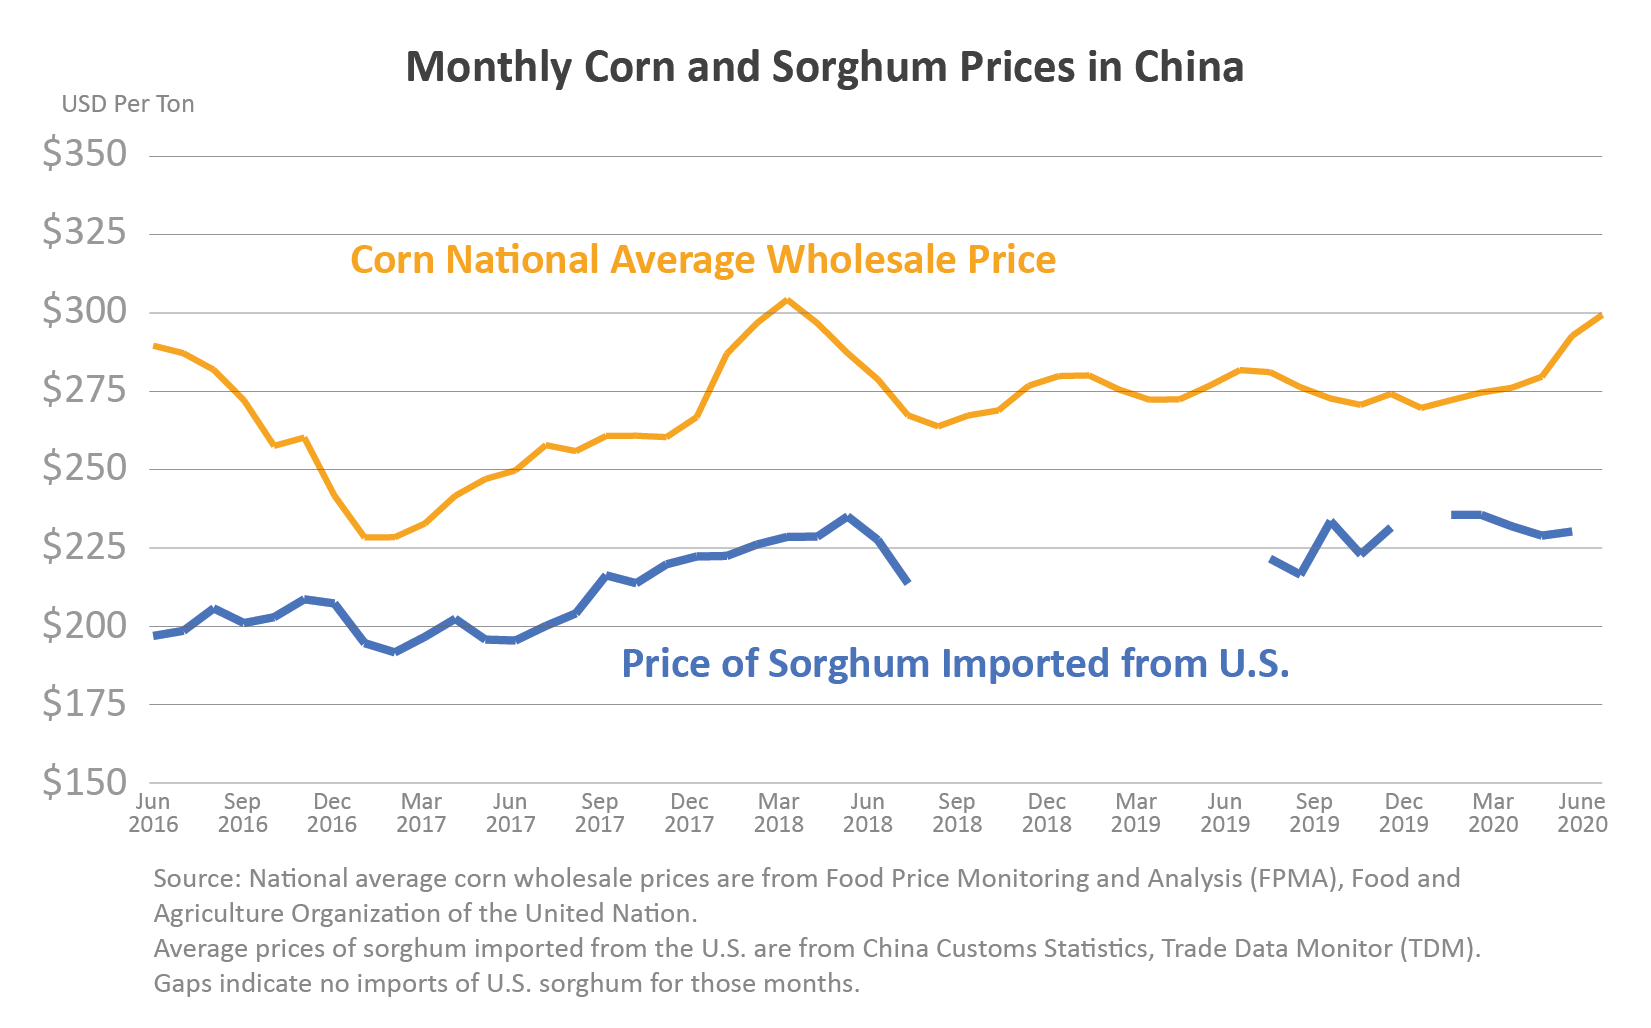
China’s announcement of tariff exclusions following the Phase One agreement had an immediate impact on U.S. sorghum exports mainly because of the sheer volume China purchases and its effect on prices. As of early-July, U.S. commitments1 to the world have more than doubled the entire volume sold in 2018/19 (Sep-Aug) and are headed to reach the 2017/18 level. About three-quarters of the commitments have been slated for China. U.S. sorghum is highly dependent on exports relative to other grains, and China has been the most important outlet in recent years. Typically, sorghum prices closely track movements of corn prices. With the return of China, sorghum prices have rallied, reaching $229 per ton in June, which was the highest since July 2015. Currently, sorghum prices hover around $215 per ton, down from last month’s peak largely influenced by corn. Corn prices rebounded in recent months supported by larger-than-anticipated corn area cuts in USDA’s June Acreage report and cooler and wetter weather forecasts for the Corn Belt.


U.S. Sorghum is Competitive in China
Sorghum is a drought-tolerant cereal crop, grown widely for both forage and grain for food and feed purposes. Sorghum is commonly used as an energy ingredient in feed rations and competes with corn based on similar feed values. An abundance of corn at competitive prices in the global market often dampens export prospects for U.S. sorghum. The states of Kansas and Texas account for nearly three-quarters of U.S. production. The United States has remained the top producer and exporter by a huge margin, although the amount of exports has been highly volatile since 2013/14 when China turned from U.S. corn to sorghum2.

Most U.S sorghum has been destined to southern China, where animal production is concentrated and feed demand runs high. The uptick in sales and shipments indicates the need for competitively priced alternative feedstuffs and reflects policy changes. Following the January U.S.-China Phase One agreement, in March China waived retaliatory tariffs on numerous agricultural products including sorghum3. Sorghum imports into China are not subject to tariff-rate quotas, and U.S. sorghum does not face any known quarantine or biotech issues that are likely to impede trade.

China purchases more sorghum than the rest of the world combined, and about 85-90 percent of imports come from the United States. Even though the country has a large surplus of corn4, domestic prices in both the grain-producing North and grain-consuming South have been higher than world levels. In fact, the national average price for wholesale corn has trended up since the end of last year and is currently the highest since March 2018. Even though the government started corn auctions in May from temporary reserves and almost all offerings at each auction have been sold5, the additional volumes have failed to tame prices. The strong uptick in prices could be attributed to a faster-than-anticipated pace of recovery from the impact of COVID lockdowns and the rebuilding of the hog sector from the outbreak of African Swine Fever. USDA projects China’s hog inventory to recover more than 70 percent of its pre-ASF level6. Moreover, worries that temporary reserves are running out and expectations that no other reserves will be opened for auction (e.g. non-temporary central, provincial, and county reserves) are apparently driving feed mills and processors to bid higher at auctions to secure supplies.
U.S. Domestic Use Falls at the Expense of Exports
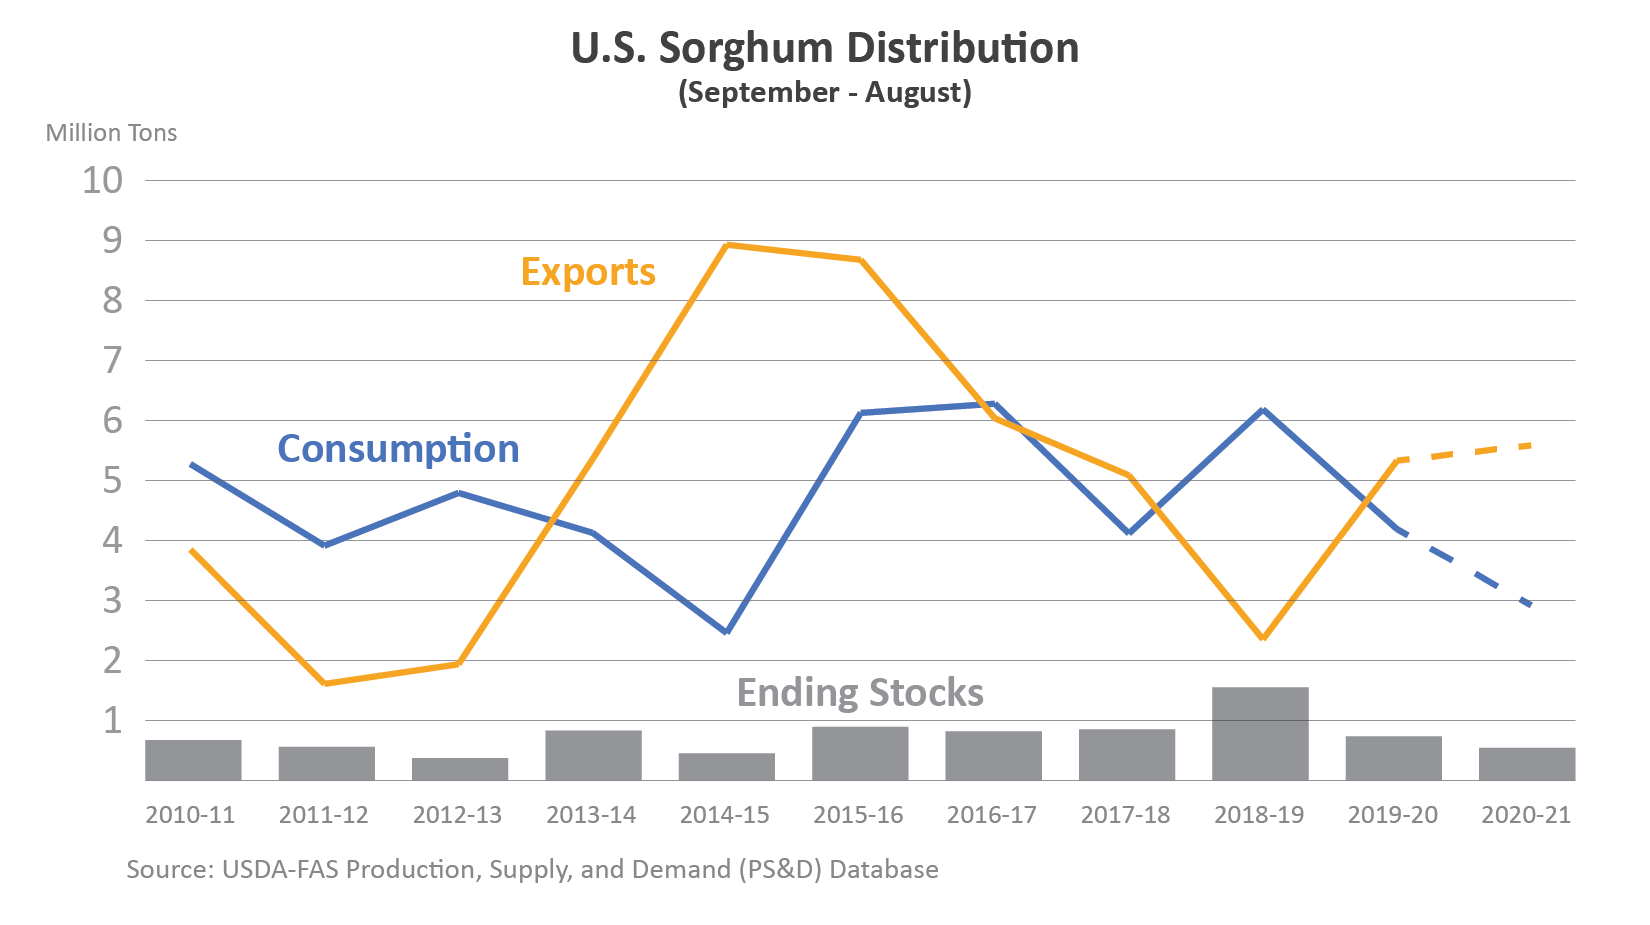
In 2018/19 when China was absent from the market due to trade actions7 and foreign demand was limited8, most sorghum was used in the U.S. domestic market for feed and for fuel ethanol. However, plentiful corn and slowing ethanol demand has dampened the need for sorghum, resulting in the largest ending stocks in 13 years.

In the spring of 2019, sorghum planting dropped 7 percent from a year earlier resulting in a smaller crop in the fall. The return of China’s demand months later in March 2020 virtually erased built-in stocks. Higher cash bids at Texas Gulf9 compared to interior bids (e.g. North, Central, and South Panhandle) clearly reflect demand for exports. The uptick in sales and shipments leaves little room in the current U.S. sorghum balance sheet and leads to the estimate of very tight 2019/20 stocks.
China’s return to U.S. sorghum roughly coincided with the planting season. Nevertheless, the Acreage report at the end of June showed a decline in area relative to planting intentions in March although up slightly from a year ago. A return to average yield levels is driving U.S. sorghum production below the 2019/20 level, further tightening supplies and giving little hope for rebuilding in 2020/21. Prospects for exports are currently expected to pressure domestic use to the lowest level since 2014/15.
