Indonesia 2020 Export Highlights
Top 10 U.S. Agricultural Exports to Indonesia(values in million USD) |
|||||||
| Commodity | 2016 | 2017 | 2018 | 2019 | 2020 | 2019-2020 % Change | 2016-2020 Average |
| Soybeans | 988 | 922 | 998 | 864 | 884 | 2% | 931 |
| Dairy Products | 158 | 132 | 165 | 239 | 352 | 47% | 209 |
| Wheat | 192 | 298 | 177 | 282 | 275 | -3% | 245 |
| Cotton | 346 | 498 | 600 | 416 | 264 | -37% | 425 |
| Feeds & Fodders | 264 | 251 | 161 | 149 | 131 | -12% | 191 |
| Soybean Meal | 14 | 28 | 123 | 15 | 96 | 525% | 55 |
| Prepared Food | 60 | 75 | 70 | 89 | 85 | -5% | 76 |
| Beef & Beef Products | 39 | 54 | 62 | 85 | 72 | -16% | 62 |
| Fresh Fruit | 81 | 64 | 52 | 59 | 48 | -19% | 61 |
| Tobacco | 85 | 55 | 71 | 42 | 43 | 2% | 59 |
| All Other | 451 | 515 | 615 | 618 | 582 | -6% | 556 |
| Total Exported | 2,678 | 2,892 | 3,094 | 2,858 | 2,832 | -1% | 2,871 |
Source: U.S. Census Bureau Trade Data - BICO HS-10
Highlights
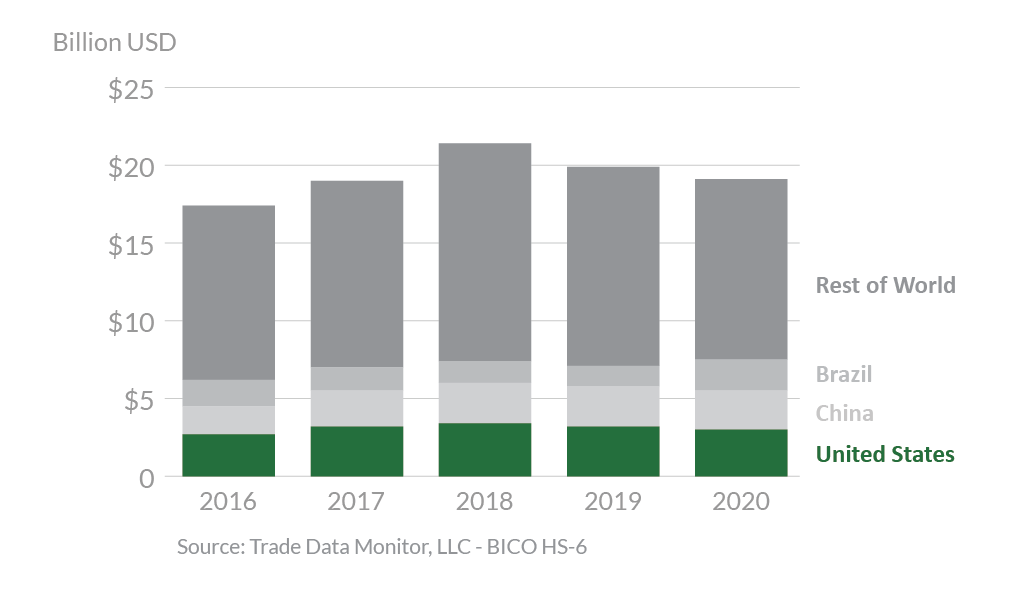
In 2020, Indonesia was the 10th-largest destination for U.S. agricultural exports, totaling $2.8 billion. This represents a 1-percent decrease from 2019 and an 8-percent fall from a record-setting 2018. The United States is Indonesia’s top supplier of agricultural goods with 16 percent market share, followed by China with 13 percent and Australia with 10 percent. Indonesia is the largest economy in Southeast Asia, with a rapidly growing middle class. The largest increases in imports from the United States were seen in dairy products and soybean meal, up $113 million and $81 million, respectively. Soybeans continued to be the largest export product to Indonesia by a wide margin, increasing $20 million from 2019 to $884 million annually. Exports of cotton plummeted, down more than 50 percent from a record high in 2018 to $264 million in 2020. Shipments of feeds & fodder, beef & beef products, and fresh fruit also declined last year, by $18 million, $13 million, and $11 million, respectively.
Drivers
- In 2020, strong demand for dairy solids from the food manufacturing sector, competitive U.S. prices, and a shift in government policy in favor of U.S. dairy products vis-à-vis European Union products boosted U.S. dairy exports to a record $352 million, an increase of 47 percent from the previous year.
- Indonesian regulations preventing the import of corn continues to drive large imports of wheat for food and feed.
- Due to a collapse in orders from Indonesia’s traditional textile markets (United States, the EU, and Japan), U.S. cotton exports plummeted 37 percent.
- Unfavorable exchange rates during the first quarter of the year followed by rapidly rising prices during the final half of the year resulted in sluggish demand for U.S. soybeans and stagnant exports. Most imported soybeans are used for foods like tempeh and tofu, not feed.
- Continued strong demand from Indonesia’s poultry sector drove strong growth in U.S. feed ingredient (dried distillers’ grains with solubles, corn gluten, soybean meal).
Indonesia’s Agricultural Suppliers

Looking Ahead
With an estimated population of 271 million and the largest economy in Southeast Asia, Indonesia is the fourth most populous country in the world with a growing middle class, which provides further opportunities for U.S. food and beverage exports. Indonesia is also in the process of reforming its import licensing system for horticultural imports, which may benefit U.S. horticultural exports destined for Indonesia by dismantling certain onerous import requirements.
U.S. agricultural exports to Indonesia also face challenges. Indonesia continues to seek “self-sufficiency” in key agricultural commodities which could mean limiting agricultural imports. In October 2019, Indonesia began a 5-year, phased-in implementation of new halal requirements for food and beverages, which is likely to pose significant challenges for U.S. exporters in years to come.
