Philippines 2020 Export Highlights
Top 10 U.S. Agricultural Exports to Philippines(values in million USD) |
|||||||
| Commodity | 2016 | 2017 | 2018 | 2019 | 2020 | 2019-2020 % Change | 2016-2020 Average |
| Soybean Meal | 729 | 747 | 884 | 788 | 899 | 14% | 810 |
| Wheat | 592 | 555 | 642 | 708 | 826 | 17% | 665 |
| Dairy Products | 227 | 243 | 246 | 273 | 410 | 50% | 280 |
| Prepared Food | 89 | 92 | 105 | 111 | 127 | 15% | 105 |
| Pork & Pork Products | 79 | 98 | 116 | 93 | 115 | 23% | 100 |
| Poultry Meat & Products* | 77 | 92 | 111 | 102 | 64 | -37% | 89 |
| Beef & Beef Products | 55 | 62 | 87 | 88 | 62 | -29% | 71 |
| Snack Foods | 63 | 54 | 59 | 60 | 59 | -2% | 59 |
| Processed Vegetables | 72 | 79 | 83 | 110 | 55 | -50% | 80 |
| Soybeans | 104 | 92 | 66 | 52 | 54 | 4% | 74 |
| All Other | 486 | 467 | 555 | 513 | 480 | -6% | 500 |
| Total Exported | 2,573 | 2,581 | 2,954 | 2,898 | 3,151 | 9% | 2,831 |
Source: U.S. Census Bureau Trade Data - BICO HS-10
*Excludes eggs
Highlights
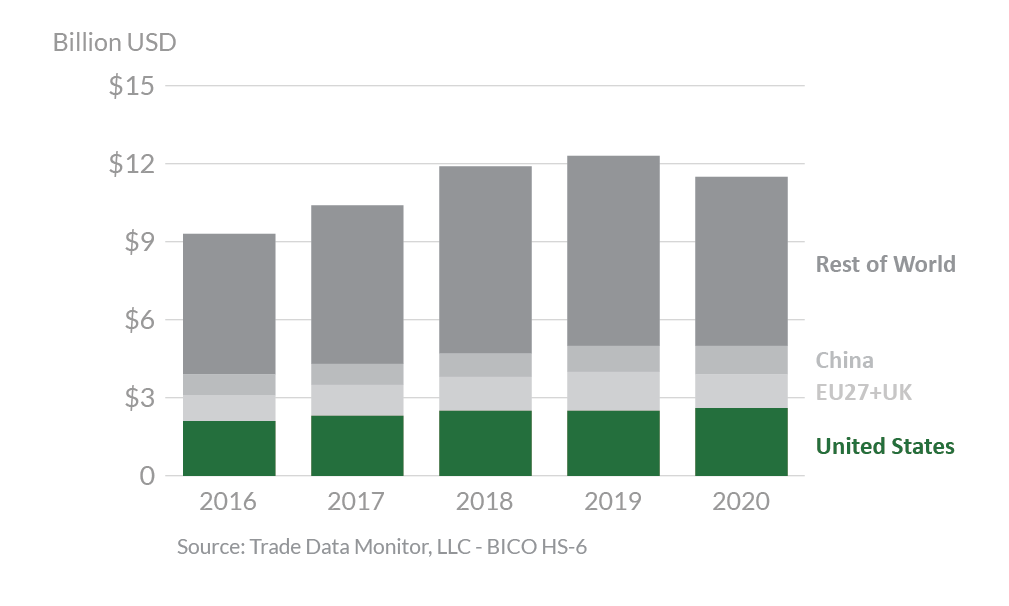
In 2020, the Philippines was the ninth-largest destination for U.S. agricultural exports, totaling $3.2 billion. This represents a 9-percent increase from 2019 and set a record for U.S. agricultural exports to the Philippines. The United States is expected to be the Philippines’s top supplier of agricultural goods with 23 percent market share, followed by the EU27+UK with 11 percent. The Philippine applied most-favored nation tariffs are among the lowest in the region and often close to the preferential rates offered to U.S. competitors. The largest export increases in 2020 were seen in dairy products, wheat, and soybean meal, up $137 million, $118 million, and $111 million, respectively. Exports of prepared foods rose 15 percent to $127 million and exports of pork products grew 23 percent after declining in 2019. Processed vegetables, poultry meat & products (excluding eggs), and beef & beef products declined in 2020 by $55 million, $38 million, and $26 million, respectively.
Drivers
- Despite a 2020 decline in the Philippine gross domestic product due to COVID-19, U.S. wheat exports increased by 17 percent from 2019. This could be attributed to strong demand for milling wheat, as Filipino consumers stocked up on wheat-based food items such as bread throughout the pandemic. The United States has nearly 100 percent market share for milling wheat.
- Despite a 2020 decline in livestock and poultry production, soybean meal exports rose 14 percent from 2019. Possible drivers could be increased aquaculture and layer production as well as hog producers switching from swill to commercial feed.
- The collapse of the quick-service restaurant industry due to COVID-19 explains a drop in U.S. frozen french fries, beef, and poultry imports. In addition, U.S. frozen french fries have faced a 10-percent tariff since 2019, whereas they were tariff-free after 2015 as a concession by the Philippines to win the WTO’s support for its extension of quantitative restrictions on rice imports.
- Increased demand for U.S. pork can be attributed to the decline in domestic Philippine pork production due to African swine fever.
Philippines’s Agricultural Suppliers

Looking Ahead
The Philippines has a young, fast-growing, and highly urbanized population with strong preference for U.S. food and beverage products. With a population of 109 million, opportunities for imported food and beverage products offer strong potential for growth into the future.
As of early 2021, certain agricultural products, such as corn, chipping potatoes, pork, and poultry products, face both in-quota and out-of-quota tariffs under the Philippines’ tariff rate quota system which can present a challenge for U.S. food and agricultural exports. Throughout 2020, the Philippines faced food inflation and the government considered reforms to its tariff rate quota system to allow greater market access for agricultural imports. A more liberalized Philippine trade policy would provide better prospects for U.S. agricultural products.
