Tree Nuts 2020 Export Highlights
Top 10 Export Markets for U.S. Tree Nuts(values in million USD) |
|||||||
| Country | 2016 | 2017 | 2018 | 2019 | 2020 | 2019-2020 % Change | 2016-2020 Average |
| EU27+UK | 2,585 | 2,707 | 2,769 | 3,115 | 2,879 | -8% | 2,811 |
| India | 521 | 738 | 663 | 823 | 914 | 11% | 732 |
| China | 182 | 243 | 328 | 606 | 746 | 23% | 421 |
| Canada | 598 | 643 | 696 | 697 | 737 | 6% | 674 |
| Japan | 374 | 398 | 434 | 416 | 386 | -7% | 402 |
| Mexico | 253 | 256 | 371 | 343 | 329 | -4% | 310 |
| United Arab Emirates | 310 | 301 | 304 | 439 | 308 | -30% | 332 |
| South Korea | 296 | 306 | 290 | 291 | 295 | 2% | 295 |
| Hong Kong | 1,156 | 1,251 | 1,052 | 692 | 271 | -61% | 884 |
| Turkey | 365 | 308 | 279 | 340 | 250 | -27% | 309 |
| All Others | 1,261 | 1,329 | 1,331 | 1,313 | 1,286 | -2% | 1,304 |
| Total Exported | 7,902 | 8,479 | 8,515 | 9,076 | 8,402 | -7% | 8,475 |
Source: U.S. Census Bureau Trade Data - BICO HS-10
Highlights
In 2020, the value of U.S. tree nut exports to the world was $8.4 billion, a 7 percent decrease from 2019. The top three markets, accounting for 54 percent of sales, were the European Union (EU27+UK) at $2.9 billion, India at $914 million, and China at $746 million. While tree nut exports were up to India (11 percent), China (23 percent), and Canada (6 percent) in 2020, this was more than offset by lower sales to Hong Kong, the EU27+UK, and the United Arab Emirates. Record harvests put downward pressure on unit values, particularly for almonds. U.S. exports continue to dominate the global almond, pistachio, and walnut markets despite disruptions due to retaliatory tariffs and restrictive phytosanitary requirements. The breakout of 2020 tree nut exports was 55 percent almonds ($4.7 billion), 20 percent pistachios ($1.7 billion), 15 percent walnuts ($1.2 billion), 5 percent pecans ($432 million), 4 percent ‘mixed & other nuts’ ($296 million), and 1 percent hazelnuts ($97 million).
Drivers
- Exports to Hong Kong declined $422 million due to China’s tightening of import controls on product passing through Hong Kong, which was only partially offset by $140 million in additional direct sales to China.
- The unit value of almonds dropped nearly 20 percent, which contributed to tree nut exports to the EU27+UK declining $236 million and the United Arab Emirates falling $131 million.
- Exports to India continue to expand on strong consumer demand for almonds, and to a lesser extent, walnuts.
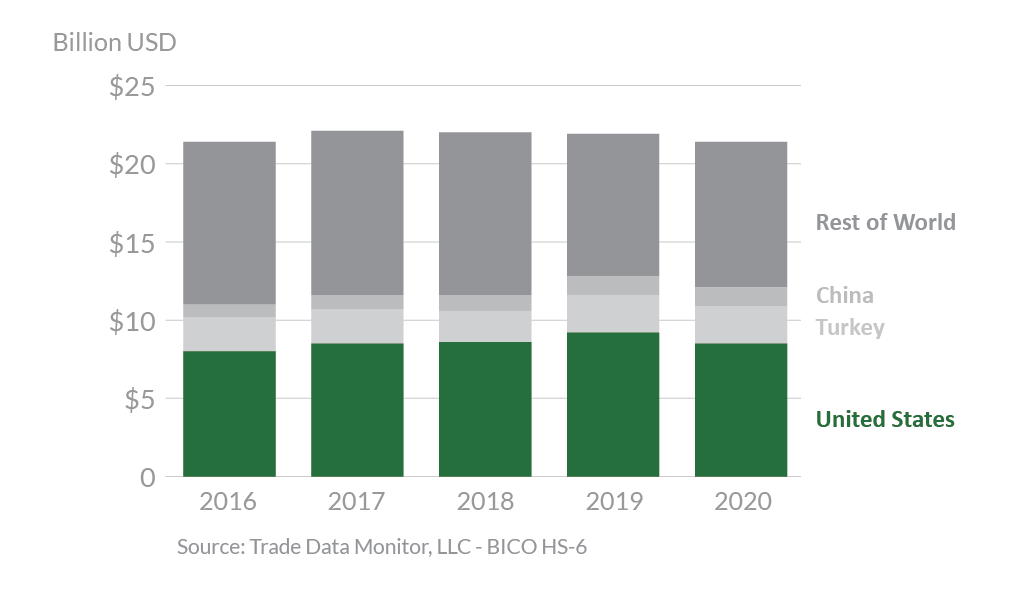
Global Tree Nut Exports

Looking Ahead
Moving forward, the United States is likely to maintain its 80 percent share of world almond production and nearly 90 percent share of trade, with limited competition from Australia. The U.S. walnut industry commands half of world trade, with modest competition from China, Chile, and Ukraine. Although China produces more than 40 percent of the world’s walnuts, its exports only account for about 15 percent of world trade due to variety preferences and strong domestic demand. The U.S. pistachio industry will likely remain in close competition with Iran to be the world’s leading producer and exporter, often trading places depending on yield conditions.
New market opportunities for U.S. tree nut exports include countries in Central and South America. The United States has competitive advantages in tree nut production and exports, with 10-year growth averaging 7 percent annually and is well-positioned to maintain its global dominance.
Some issues affecting future sales include compliance with pesticide maximum residue levels (MRLs) which has increasingly presented exporters with challenges selling to the European Union. The United States continues to advocate for countries to adopt science-based standards. U.S. tree nut producers also face concern over Japan’s stringent enforcement and testing protocol for aflatoxins which lead to 100 percent monitoring on U.S. shipments. The speed at which the global economy recovers from the COVID pandemic will impact the recovery in tree nut exports.
